
Why NYSE:MO is a Top Pick for Dividend Investors.
By Mill Chart
Last update: Oct 3, 2024
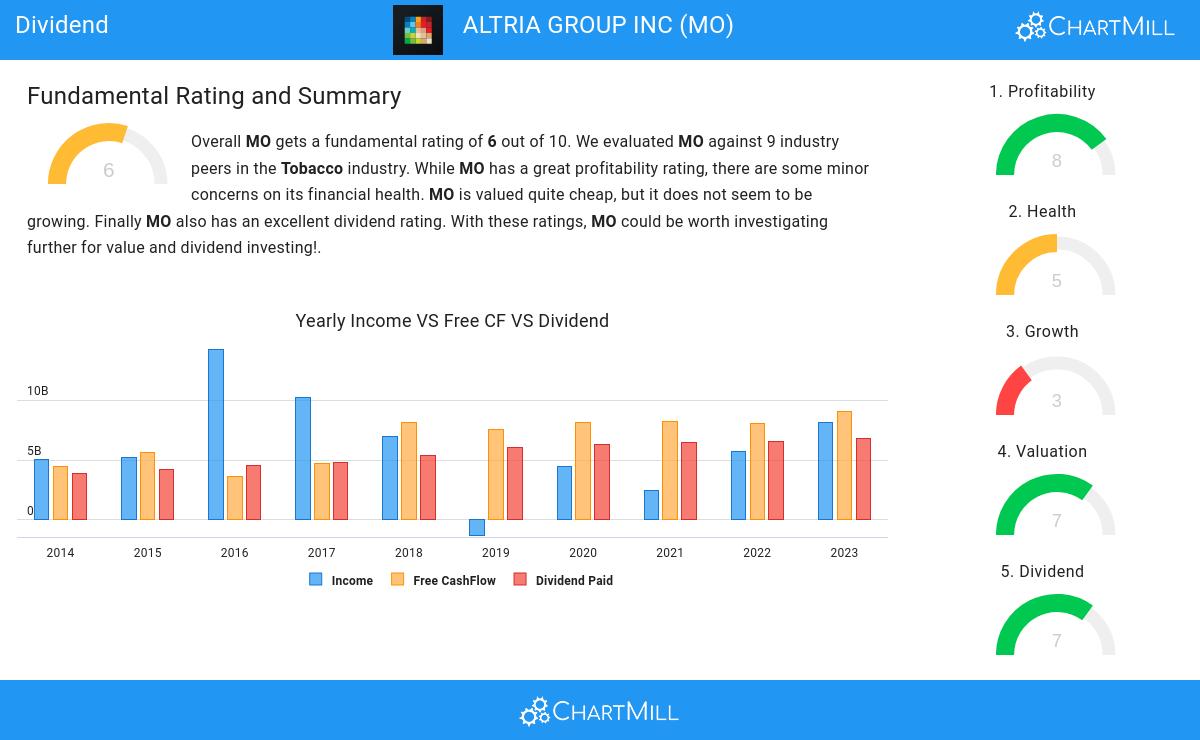
ALTRIA GROUP INC (NYSE:MO) was identified as a stock worth exploring by dividend investors by our stock screener. NYSE:MO scores well on profitability, solvency and liquidity. At the same time it seems to pay a decent dividend. We'll explore this a bit deeper below.
Exploring NYSE:MO's Dividend
ChartMill provides a Dividend Rating for every stock, ranging from 0 to 10. This rating assesses various dividend aspects, including yield, growth, and sustainability. NYSE:MO earns a 7 out of 10:
- MO has a Yearly Dividend Yield of 7.99%, which is a nice return.
- MO's Dividend Yield is rather good when compared to the industry average which is at 4.79. MO pays more dividend than 88.89% of the companies in the same industry.
- MO's Dividend Yield is rather good when compared to the S&P500 average which is at 2.20.
- MO has paid a dividend for at least 10 years, which is a reliable track record.
- MO has not decreased their dividend for at least 10 years, which is a reliable track record.
Assessing Health Metrics for NYSE:MO
ChartMill assigns a proprietary Health Rating to each stock. The score is computed by evaluating various liquidity and solvency ratios and ranges from 0 to 10. NYSE:MO was assigned a score of 5 for health:
- An Altman-Z score of 4.41 indicates that MO is not in any danger for bankruptcy at the moment.
- MO has a Altman-Z score of 4.41. This is amongst the best in the industry. MO outperforms 88.89% of its industry peers.
- The Debt to FCF ratio of MO is 2.84, which is a good value as it means it would take MO, 2.84 years of fcf income to pay off all of its debts.
- With an excellent Debt to FCF ratio value of 2.84, MO belongs to the best of the industry, outperforming 100.00% of the companies in the same industry.
Profitability Examination for NYSE:MO
ChartMill assigns a Profitability Rating to every stock. This score ranges from 0 to 10 and evaluates the different profitability ratios and margins, both absolutely, but also relative to the industry peers. NYSE:MO scores a 8 out of 10:
- MO has a Return On Assets of 29.47%. This is amongst the best in the industry. MO outperforms 100.00% of its industry peers.
- The Return On Invested Capital of MO (33.01%) is better than 88.89% of its industry peers.
- The last Return On Invested Capital (33.01%) for MO is above the 3 year average (31.67%), which is a sign of increasing profitability.
- Looking at the Profit Margin, with a value of 42.15%, MO belongs to the top of the industry, outperforming 100.00% of the companies in the same industry.
- In the last couple of years the Profit Margin of MO has grown nicely.
- MO has a Operating Margin of 47.93%. This is amongst the best in the industry. MO outperforms 88.89% of its industry peers.
- In the last couple of years the Operating Margin of MO has grown nicely.
- MO's Gross Margin of 58.64% is fine compared to the rest of the industry. MO outperforms 77.78% of its industry peers.
- MO's Gross Margin has improved in the last couple of years.
Our Best Dividend screener lists more Best Dividend stocks and is updated daily.
Check the latest full fundamental report of MO for a complete fundamental analysis.
Disclaimer
Important Note: The content of this article is not intended as trading advice. It is essential to perform your own analysis and exercise caution when making trading decisions. The article presents observations created by automated analysis but does not guarantee any trading or investment outcomes. Always trade responsibly and make independent judgments.
58.16
+0.89 (+1.55%)
Find more stocks in the Stock Screener
MO Latest News and Analysis
 18 days ago - ChartmillStay informed with the top movers within the S&P500 index on Wednesday.
Get insights into the S&P500 index performance on Wednesday. Explore the top gainers and losers within the S&P500 index in today's session.
18 days ago - ChartmillWednesday's session: top gainers and losers in the S&P500 indexStay updated with the movements of the S&P500 index in the middle of the day on Wednesday. Discover which stocks are leading as top gainers and losers in today's session.
 18 days ago - ChartmillWhat's going on in today's session: S&P500 gap up and gap down stocks
Wondering what's happening in today's session regarding gap up and gap down stocks? Explore the S&P500 index on Wednesday to uncover the stocks that are gapping in the S&P500 index.
20 days ago - ChartmillExploring the top movers within the S&P500 index during today's session.Let's have a look at what is happening on the US markets in the middle of the day on Monday. Below you can find the top S&P500 gainers and losers in today's session.
