
Why NYSE:MO provides a good dividend, while having solid fundamentals.
By Mill Chart
Last update: Sep 12, 2024
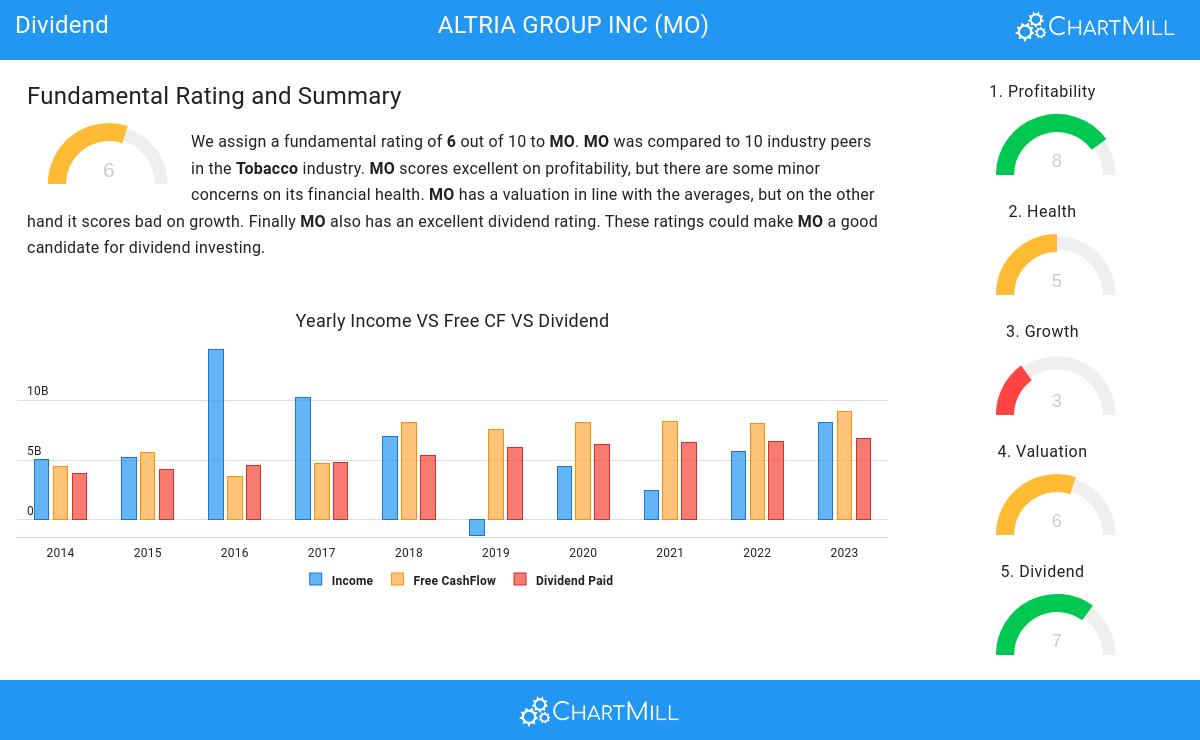
Discover ALTRIA GROUP INC (NYSE:MO)—a stock that our stock screener has recognized as a solid dividend pick with strong fundamentals. NYSE:MO showcases decent financial health and profitability while providing a sustainable dividend. We'll explore the specifics further.
Understanding NYSE:MO's Dividend
To gauge a stock's dividend quality, ChartMill utilizes a Dividend Rating ranging from 0 to 10. This comprehensive assessment considers various dividend aspects, including yield, history, growth, and sustainability. NYSE:MO has achieved a 7 out of 10:
- With a Yearly Dividend Yield of 7.52%, MO is a good candidate for dividend investing.
- Compared to an average industry Dividend Yield of 4.62, MO pays a better dividend. On top of this MO pays more dividend than 90.00% of the companies listed in the same industry.
- Compared to an average S&P500 Dividend Yield of 2.26, MO pays a better dividend.
- MO has paid a dividend for at least 10 years, which is a reliable track record.
- MO has not decreased its dividend for at least 10 years, so it has a reliable track record of non decreasing dividend.
Analyzing Health Metrics
ChartMill utilizes a Health Rating to assess stocks, scoring them on a scale of 0 to 10. This rating takes into account a variety of liquidity and solvency ratios, both in absolute terms and in comparison to industry peers. NYSE:MO has earned a 5 out of 10:
- An Altman-Z score of 4.48 indicates that MO is not in any danger for bankruptcy at the moment.
- The Altman-Z score of MO (4.48) is better than 80.00% of its industry peers.
- The Debt to FCF ratio of MO is 2.84, which is a good value as it means it would take MO, 2.84 years of fcf income to pay off all of its debts.
- Looking at the Debt to FCF ratio, with a value of 2.84, MO belongs to the top of the industry, outperforming 100.00% of the companies in the same industry.
Profitability Insights: NYSE:MO
ChartMill utilizes a Profitability Rating to assess stocks, scoring them on a scale of 0 to 10. This rating takes into account a variety of profitability ratios and margins, both in absolute terms and in comparison to industry peers. NYSE:MO has earned a 8 out of 10:
- MO's Return On Assets of 29.47% is amongst the best of the industry. MO outperforms 100.00% of its industry peers.
- The Return On Invested Capital of MO (33.01%) is better than 90.00% of its industry peers.
- The 3 year average ROIC (31.67%) for MO is below the current ROIC(33.01%), indicating increased profibility in the last year.
- Looking at the Profit Margin, with a value of 42.15%, MO belongs to the top of the industry, outperforming 100.00% of the companies in the same industry.
- MO's Profit Margin has improved in the last couple of years.
- The Operating Margin of MO (47.93%) is better than 90.00% of its industry peers.
- In the last couple of years the Operating Margin of MO has grown nicely.
- Looking at the Gross Margin, with a value of 58.64%, MO is in the better half of the industry, outperforming 80.00% of the companies in the same industry.
- MO's Gross Margin has improved in the last couple of years.
Our Best Dividend screener lists more Best Dividend stocks and is updated daily.
For an up to date full fundamental analysis you can check the fundamental report of MO
Disclaimer
Important Note: The content of this article is not intended as trading advice. It is essential to perform your own analysis and exercise caution when making trading decisions. The article presents observations created by automated analysis but does not guarantee any trading or investment outcomes. Always trade responsibly and make independent judgments.
58.16
+0.89 (+1.55%)
Find more stocks in the Stock Screener
MO Latest News and Analysis
 18 days ago - ChartmillStay informed with the top movers within the S&P500 index on Wednesday.
Get insights into the S&P500 index performance on Wednesday. Explore the top gainers and losers within the S&P500 index in today's session.
18 days ago - ChartmillWednesday's session: top gainers and losers in the S&P500 indexStay updated with the movements of the S&P500 index in the middle of the day on Wednesday. Discover which stocks are leading as top gainers and losers in today's session.
 18 days ago - ChartmillWhat's going on in today's session: S&P500 gap up and gap down stocks
Wondering what's happening in today's session regarding gap up and gap down stocks? Explore the S&P500 index on Wednesday to uncover the stocks that are gapping in the S&P500 index.
20 days ago - ChartmillExploring the top movers within the S&P500 index during today's session.Let's have a look at what is happening on the US markets in the middle of the day on Monday. Below you can find the top S&P500 gainers and losers in today's session.
