NYSE:MMS, an undervalued stock with good fundamentals.
By Mill Chart
Last update: Feb 24, 2025
MAXIMUS INC (NYSE:MMS) was identified as a decent value stock by our stock screener. NYSE:MMS scores well on profitability, solvency and liquidity. At the same time it seems to be priced very reasonably. We'll explore this a bit deeper below.
Valuation Assessment of NYSE:MMS
An integral part of ChartMill's stock analysis is the Valuation Rating, which spans from 0 to 10. This rating evaluates diverse valuation factors, including price to earnings and cash flows, while considering the stock's profitability and growth. NYSE:MMS has received a 8 out of 10:
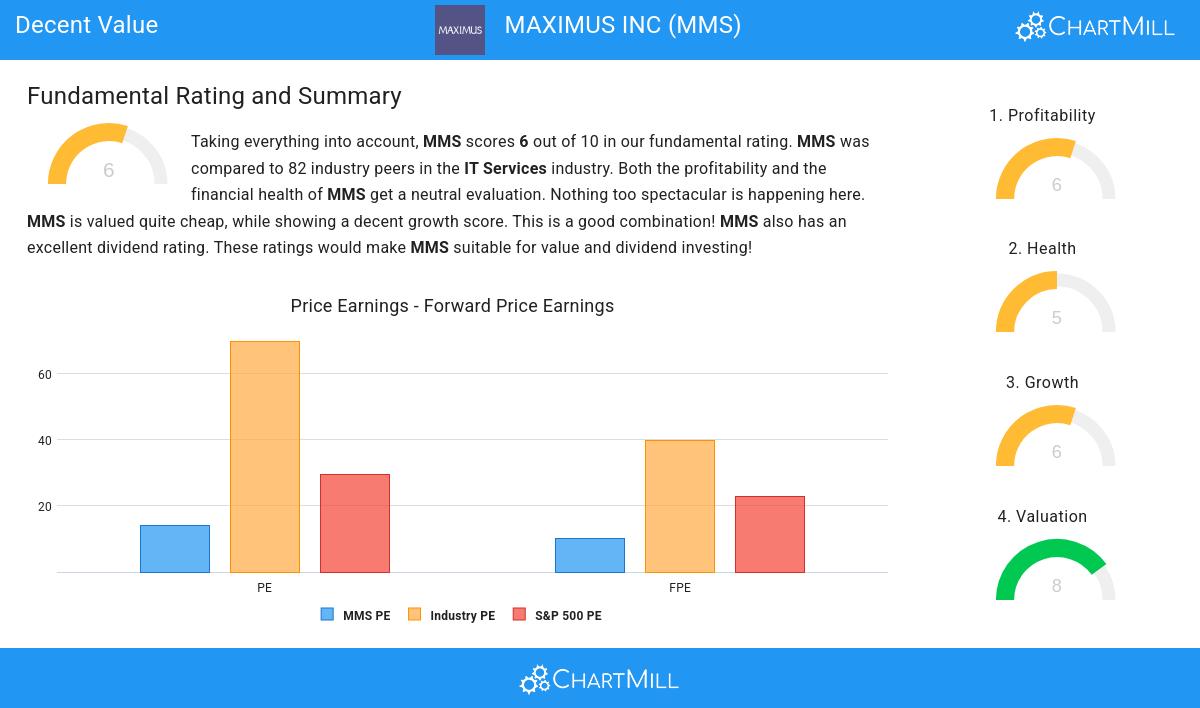
- Compared to the rest of the industry, the Price/Earnings ratio of MMS indicates a rather cheap valuation: MMS is cheaper than 82.05% of the companies listed in the same industry.
- MMS is valuated cheaply when we compare the Price/Earnings ratio to 29.62, which is the current average of the S&P500 Index.
- The Price/Forward Earnings ratio is 10.27, which indicates a very decent valuation of MMS.
- Compared to the rest of the industry, the Price/Forward Earnings ratio of MMS indicates a rather cheap valuation: MMS is cheaper than 91.03% of the companies listed in the same industry.
- Compared to an average S&P500 Price/Forward Earnings ratio of 22.70, MMS is valued rather cheaply.
- MMS's Enterprise Value to EBITDA ratio is rather cheap when compared to the industry. MMS is cheaper than 85.90% of the companies in the same industry.
- Compared to the rest of the industry, the Price/Free Cash Flow ratio of MMS indicates a rather cheap valuation: MMS is cheaper than 88.46% of the companies listed in the same industry.
- The low PEG Ratio(NY), which compensates the Price/Earnings for growth, indicates a rather cheap valuation of the company.
- The decent profitability rating of MMS may justify a higher PE ratio.
- A more expensive valuation may be justified as MMS's earnings are expected to grow with 13.35% in the coming years.
Analyzing Profitability Metrics
ChartMill's Profitability Rating offers a unique perspective on stock analysis, providing scores from 0 to 10. These ratings consider a wide range of profitability metrics and margins, both in comparison to industry peers and on their own merits. For NYSE:MMS, the assigned 6 is a significant indicator of profitability:
- MMS has a Return On Assets of 7.00%. This is in the better half of the industry: MMS outperforms 75.64% of its industry peers.
- Looking at the Return On Equity, with a value of 17.24%, MMS is in the better half of the industry, outperforming 76.92% of the companies in the same industry.
- MMS has a Return On Invested Capital of 10.55%. This is in the better half of the industry: MMS outperforms 76.92% of its industry peers.
- The last Return On Invested Capital (10.55%) for MMS is above the 3 year average (8.80%), which is a sign of increasing profitability.
- Looking at the Profit Margin, with a value of 5.28%, MMS is in the better half of the industry, outperforming 64.10% of the companies in the same industry.
- MMS has a better Operating Margin (8.69%) than 66.67% of its industry peers.
How do we evaluate the Health for NYSE:MMS?
To gauge a stock's financial health, ChartMill utilizes a Health Rating on a scale of 0 to 10. This comprehensive evaluation encompasses liquidity and solvency, both in absolute terms and in comparison to industry peers. NYSE:MMS has earned a 5 out of 10:
- An Altman-Z score of 3.15 indicates that MMS is not in any danger for bankruptcy at the moment.
Growth Examination for NYSE:MMS
ChartMill assigns a Growth Rating to every stock. This score ranges from 0 to 10 and evaluates the different growth aspects like EPS and Revenue, both in the past as in the future. NYSE:MMS scores a 6 out of 10:
- MMS shows a strong growth in Earnings Per Share. In the last year, the EPS has been growing by 53.97%, which is quite impressive.
- Looking at the last year, MMS shows a quite strong growth in Revenue. The Revenue has grown by 8.01% in the last year.
- MMS shows quite a strong growth in Revenue. Measured over the last years, the Revenue has been growing by 12.95% yearly.
- MMS is expected to show quite a strong growth in Earnings Per Share. In the coming years, the EPS will grow by 13.35% yearly.
- When comparing the EPS growth rate of the last years to the growth rate of the upcoming years, we see that the growth is accelerating.
More Decent Value stocks can be found in our Decent Value screener.
For an up to date full fundamental analysis you can check the fundamental report of MMS
Keep in mind
Important Note: The content of this article is not intended as trading advice. It is essential to perform your own analysis and exercise caution when making trading decisions. The article presents observations created by automated analysis but does not guarantee any trading or investment outcomes. Always trade responsibly and make independent judgments.
66
-0.76 (-1.14%)
Find more stocks in the Stock Screener
MMS Latest News and Analysis
 2 minutes ago - ChartmillNYSE:MMS, an undervalued stock with good fundamentals.
Discover MAXIMUS INC, an undervalued stock. NYSE:MMS showcases solid financial health and profitability while maintaining an appealing valuation.
