Exploring NASDAQ:LYTS's CANSLIM characteristics.
By Mill Chart
Last update: Feb 19, 2025
Groth investors are looking for stocks showing high revenue and EPS growth. We will have a look here to see if LSI INDUSTRIES INC (NASDAQ:LYTS) is suited for growth investing. Investors should of course do their own research, but we spotted LSI INDUSTRIES INC showing up in our CANSLIM growth screen, so it may be worth spending some more time on it.
Why NASDAQ:LYTS may be interesting for canslim investors.
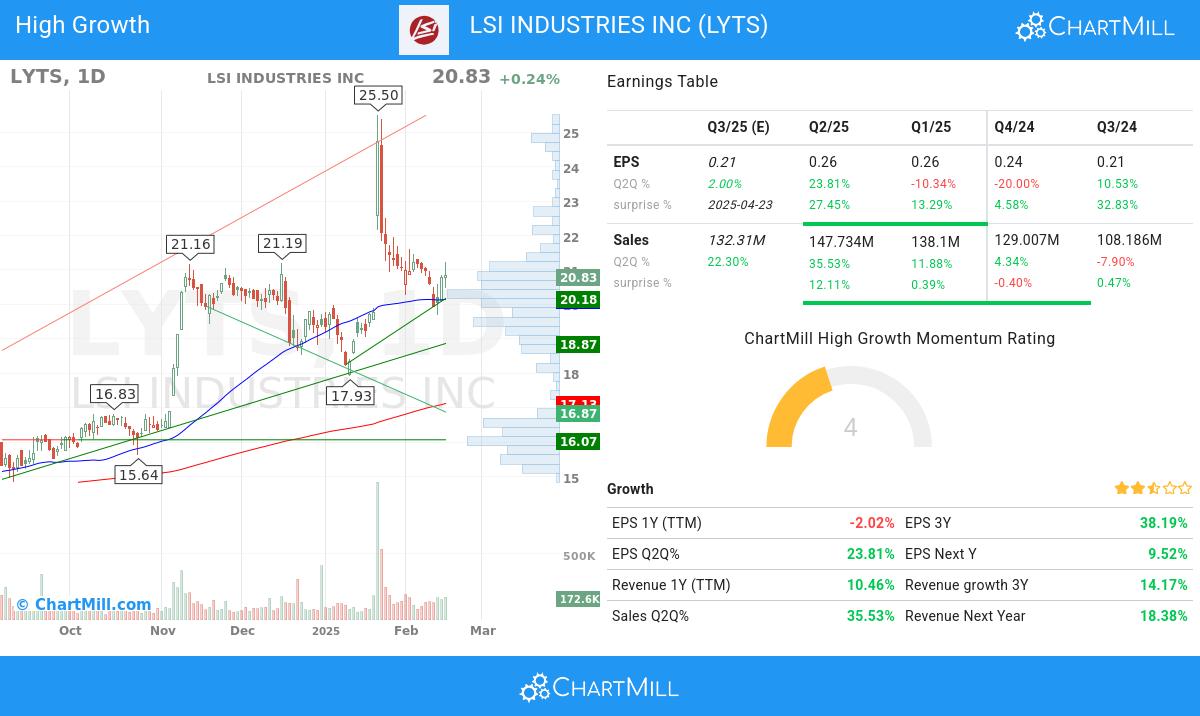
- The earnings per share (EPS) of LSI INDUSTRIES INC have shown positive growth on a quarter-to-quarter (Q2Q) basis, with a 23.81% increase. This reflects the company's ability to improve its profitability over time.
- LSI INDUSTRIES INC has achieved 35.53% growth in its revenue over the previous quarter, signaling positive momentum in its financial performance and potential market opportunities.
- LSI INDUSTRIES INC has achieved 38.19% growth in EPS over the past 3 years, reflecting a sustained improvement in earnings performance.
- With a solid Return on Equity (ROE) of 10.76%, LSI INDUSTRIES INC exemplifies its ability to generate favorable returns on shareholder investments. This metric demonstrates the company's commitment to maximizing shareholder value.
- The Relative Strength (RS) of LSI INDUSTRIES INC has consistently been strong, with a current 85.34 rating. This indicates the stock's ability to exhibit relative price outperformance and reflects its competitive strength. LSI INDUSTRIES INC demonstrates promising potential for sustained price momentum.
- LSI INDUSTRIES INC maintains a healthy Debt-to-Equity ratio of 0.16. This indicates the company's conservative capital structure and signifies its ability to effectively manage debt obligations while maintaining a strong equity position.
- LSI INDUSTRIES INC demonstrates a balanced ownership structure, with institutional shareholders at 73.16%. This indicates a diverse investor base, which can contribute to price stability and potential future growth.
Deciphering the Technical Picture of NASDAQ:LYTS
At ChartMill, a crucial aspect of their analysis is the assignment of a Technical Rating to each stock. This rating, ranging from 0 to 10, is calculated daily by considering numerous technical indicators and properties.
We assign a technical rating of 8 out of 10 to LYTS. This is due to a consistent performance in both the short and longer term time frames. Also compared to the overall market, LYTS is showing a nice and steady performance.
- The long term trend is positive and the short term trend is neutral. The long term trend may just continue or reversal may be around the corner!
- When comparing the yearly performance of all stocks, we notice that LYTS is one of the better performing stocks in the market, outperforming 85% of all stocks.
- LYTS is one of the better performing stocks in the Electrical Equipment industry, it outperforms 82% of 93 stocks in the same industry.
- LYTS is currently trading in the middle of its 52 week range. The S&P500 Index however is currently trading near new highs, so LYTS is lagging the market.
Check the latest full technical report of LYTS for a complete technical analysis.
A complete fundamental analysis of NASDAQ:LYTS
Every day ChartMill assigns a Fundamental Rating to every stock. The score ranges from 0 to 10 and is determined by evaluating multiple fundamental indicators and properties.
Overall LYTS gets a fundamental rating of 6 out of 10. We evaluated LYTS against 93 industry peers in the Electrical Equipment industry. LYTS has an excellent profitability rating, but there are some minor concerns on its financial health. LYTS is not valued too expensively and it also shows a decent growth rate.
Our latest full fundamental report of LYTS contains the most current fundamental analsysis.
More ideas for growth investing can be found on ChartMill in our CANSLIM screen.
Keep in mind
This article should in no way be interpreted as advice. The article is based on the observed metrics at the time of writing, but you should always make your own analysis and trade or invest at your own responsibility.
19.26
-0.88 (-4.37%)
Find more stocks in the Stock Screener
LYTS Latest News and Analysis
 3 days ago - ChartmillExploring NASDAQ:LYTS's CANSLIM characteristics.
A fundamental analysis of (NASDAQ:LYTS): High growth, ROE and relative strength for LSI INDUSTRIES INC (NASDAQ:LYTS), growth investors may appreciate this.
