In the world of growth stocks, STRIDE INC (NYSE:LRN) shines as a value proposition.
By Mill Chart
Last update: Apr 29, 2025
Here's STRIDE INC (NYSE:LRN) for you, a growth stock our stock screener believes is undervalued. LRN is scoring impressively in terms of growth while demonstrating strong financials. On top of that, it remains attractively priced. Let's break it down further.
Evaluating Growth: LRN
To evaluate a stock's growth potential, ChartMill utilizes a Growth Rating on a scale of 0 to 10. This comprehensive assessment considers various growth aspects, including historical and estimated EPS and revenue growth. LRN has achieved a 7 out of 10:
- The Earnings Per Share has grown by an impressive 51.26% over the past year.
- The Earnings Per Share has been growing by 39.31% on average over the past years. This is a very strong growth
- LRN shows quite a strong growth in Revenue. In the last year, the Revenue has grown by 13.13%.
- Measured over the past years, LRN shows a quite strong growth in Revenue. The Revenue has been growing by 14.97% on average per year.
- LRN is expected to show a strong growth in Earnings Per Share. In the coming years, the EPS will grow by 20.90% yearly.
- The Revenue is expected to grow by 9.53% on average over the next years. This is quite good.
Valuation Analysis for LRN
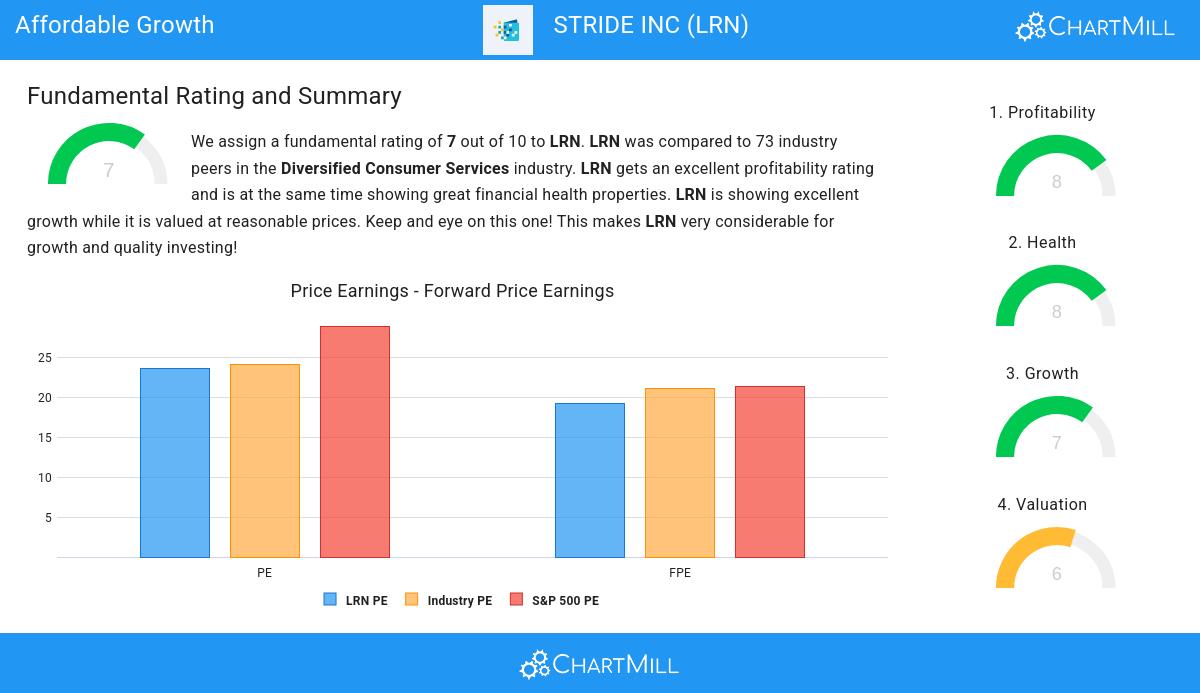
ChartMill assigns a proprietary Valuation Rating to each stock. The score is computed by evaluating various valuation aspects, like price to earnings and free cash flow, both absolutely as relative to the market and industry. LRN was assigned a score of 6 for valuation:
- Based on the Price/Earnings ratio, LRN is valued a bit cheaper than the industry average as 63.01% of the companies are valued more expensively.
- Based on the Price/Forward Earnings ratio, LRN is valued a bit cheaper than the industry average as 65.75% of the companies are valued more expensively.
- LRN's Enterprise Value to EBITDA ratio is a bit cheaper when compared to the industry. LRN is cheaper than 61.64% of the companies in the same industry.
- LRN's Price/Free Cash Flow ratio is a bit cheaper when compared to the industry. LRN is cheaper than 68.49% of the companies in the same industry.
- LRN's low PEG Ratio(NY), which compensates the Price/Earnings for growth, indicates a rather cheap valuation of the company.
- The excellent profitability rating of LRN may justify a higher PE ratio.
- A more expensive valuation may be justified as LRN's earnings are expected to grow with 20.90% in the coming years.
Assessing Health Metrics for LRN
ChartMill utilizes a Health Rating to assess stocks, scoring them on a scale of 0 to 10. This rating takes into account a variety of liquidity and solvency ratios, both in absolute terms and in comparison to industry peers. LRN has earned a 8 out of 10:
- An Altman-Z score of 7.62 indicates that LRN is not in any danger for bankruptcy at the moment.
- Looking at the Altman-Z score, with a value of 7.62, LRN belongs to the top of the industry, outperforming 91.78% of the companies in the same industry.
- The Debt to FCF ratio of LRN is 1.96, which is an excellent value as it means it would take LRN, only 1.96 years of fcf income to pay off all of its debts.
- LRN has a Debt to FCF ratio of 1.96. This is amongst the best in the industry. LRN outperforms 82.19% of its industry peers.
- A Debt/Equity ratio of 0.35 indicates that LRN is not too dependend on debt financing.
- LRN has a Current Ratio of 6.02. This indicates that LRN is financially healthy and has no problem in meeting its short term obligations.
- LRN's Current ratio of 6.02 is amongst the best of the industry. LRN outperforms 93.15% of its industry peers.
- A Quick Ratio of 5.93 indicates that LRN has no problem at all paying its short term obligations.
- LRN has a Quick ratio of 5.93. This is amongst the best in the industry. LRN outperforms 93.15% of its industry peers.
Profitability Insights: LRN
Discover ChartMill's exclusive Profitability Rating, a proprietary metric that assesses stocks on a scale of 0 to 10. It takes into consideration various profitability ratios and margins, both in absolute terms and relative to industry peers. Notably, LRN has achieved a 8:
- Looking at the Return On Assets, with a value of 13.03%, LRN belongs to the top of the industry, outperforming 91.78% of the companies in the same industry.
- LRN's Return On Equity of 20.46% is amongst the best of the industry. LRN outperforms 87.67% of its industry peers.
- With an excellent Return On Invested Capital value of 13.60%, LRN belongs to the best of the industry, outperforming 90.41% of the companies in the same industry.
- The last Return On Invested Capital (13.60%) for LRN is above the 3 year average (9.47%), which is a sign of increasing profitability.
- LRN has a Profit Margin of 12.30%. This is amongst the best in the industry. LRN outperforms 84.93% of its industry peers.
- In the last couple of years the Profit Margin of LRN has grown nicely.
- The Operating Margin of LRN (15.25%) is better than 80.82% of its industry peers.
- In the last couple of years the Operating Margin of LRN has grown nicely.
- LRN's Gross Margin has improved in the last couple of years.
Our Affordable Growth screener lists more Affordable Growth stocks and is updated daily.
For an up to date full fundamental analysis you can check the fundamental report of LRN
Keep in mind
This article should in no way be interpreted as advice. The article is based on the observed metrics at the time of writing, but you should always make your own analysis and trade or invest at your own responsibility.
140.86
-0.13 (-0.09%)
Find more stocks in the Stock Screener
LRN Latest News and Analysis
 a minute ago - ChartmillIn the world of growth stocks, STRIDE INC (NYSE:LRN) shines as a value proposition.
STRIDE INC was identified as a growth stock that isn't overvalued. NYSE:LRN is excelling in various growth indicators while maintaining a solid financial footing.
 4 days ago - ChartmillShould you consider STRIDE INC (NYSE:LRN) for quality investing?
A fundamental analysis of (NYSE:LRN): In this article we'll explore the quality characteristics of STRIDE INC (NYSE:LRN)
 14 days ago - ChartmillDelving into STRIDE INC (NYSE:LRN)'s high Growth Prospects.
A fundamental and technical analysis of (NYSE:LRN): Exploring STRIDE INC (NYSE:LRN)'s high growth characteristics.
