In the world of growth stocks, LANTHEUS HOLDINGS INC (NASDAQ:LNTH) shines as a value proposition.
By Mill Chart
Last update: Apr 29, 2025
Take a closer look at LANTHEUS HOLDINGS INC (NASDAQ:LNTH), an affordable growth stock uncovered by our stock screener. LNTH boasts strong growth prospects and excels in financial health indicators, all while maintaining a reasonable valuation. Let's break it down further.
What does the Growth looks like for LNTH
To evaluate a stock's growth potential, ChartMill utilizes a Growth Rating on a scale of 0 to 10. This comprehensive assessment considers various growth aspects, including historical and estimated EPS and revenue growth. LNTH has achieved a 7 out of 10:
- LNTH shows a strong growth in Earnings Per Share. In the last year, the EPS has been growing by 8.83%, which is quite good.
- The Earnings Per Share has been growing by 42.10% on average over the past years. This is a very strong growth
- Looking at the last year, LNTH shows a quite strong growth in Revenue. The Revenue has grown by 18.32% in the last year.
- The Revenue has been growing by 34.59% on average over the past years. This is a very strong growth!
- LNTH is expected to show quite a strong growth in Earnings Per Share. In the coming years, the EPS will grow by 9.23% yearly.
- The Revenue is expected to grow by 8.86% on average over the next years. This is quite good.
Evaluating Valuation: LNTH
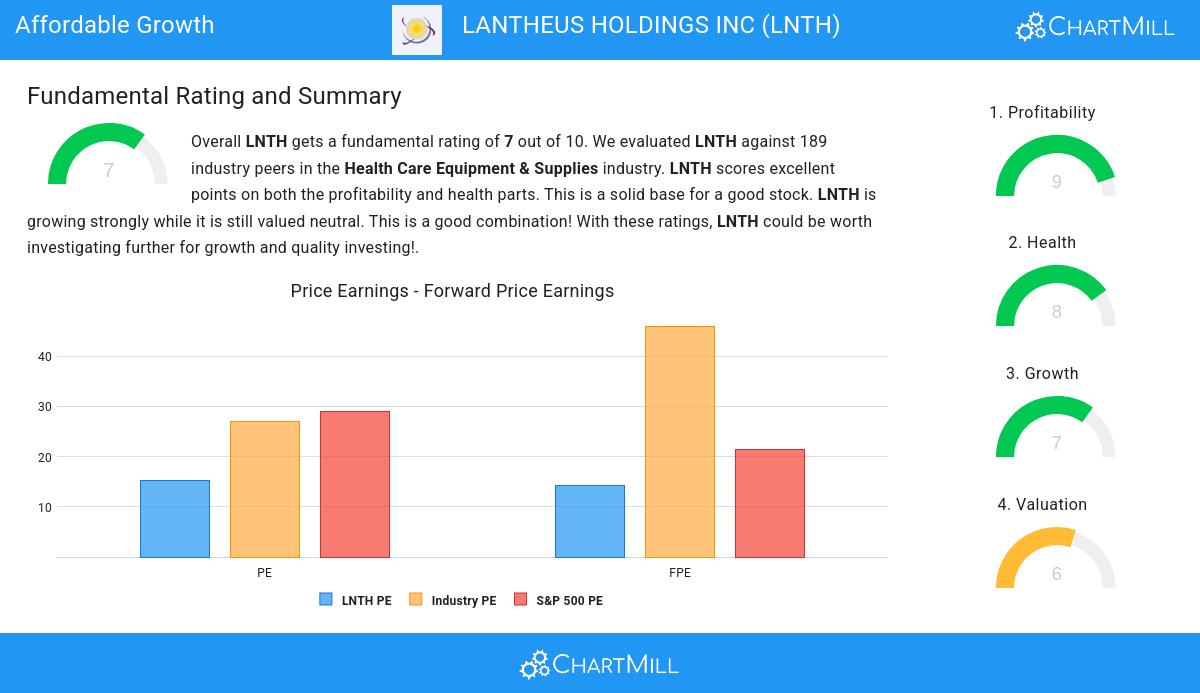
ChartMill employs its own Valuation Rating system for all stocks. This score, ranging from 0 to 10, is determined by evaluating different valuation factors, including price to earnings and free cash flow, both in absolute terms and relative to the market and industry. LNTH has earned a 6 for valuation:
- Compared to the rest of the industry, the Price/Earnings ratio of LNTH indicates a rather cheap valuation: LNTH is cheaper than 87.30% of the companies listed in the same industry.
- Compared to an average S&P500 Price/Earnings ratio of 28.87, LNTH is valued a bit cheaper.
- 86.24% of the companies in the same industry are more expensive than LNTH, based on the Price/Forward Earnings ratio.
- When comparing the Price/Forward Earnings ratio of LNTH to the average of the S&P500 Index (21.38), we can say LNTH is valued slightly cheaper.
- Based on the Enterprise Value to EBITDA ratio, LNTH is valued cheaper than 84.13% of the companies in the same industry.
- 89.95% of the companies in the same industry are more expensive than LNTH, based on the Price/Free Cash Flow ratio.
- LNTH has an outstanding profitability rating, which may justify a higher PE ratio.
Health Assessment of LNTH
ChartMill employs its own Health Rating for stock assessment. This rating, ranging from 0 to 10, is calculated by examining various liquidity and solvency ratios. In the case of LNTH, the assigned 8 reflects its health status:
- An Altman-Z score of 7.22 indicates that LNTH is not in any danger for bankruptcy at the moment.
- With an excellent Altman-Z score value of 7.22, LNTH belongs to the best of the industry, outperforming 87.30% of the companies in the same industry.
- LNTH has a debt to FCF ratio of 1.22. This is a very positive value and a sign of high solvency as it would only need 1.22 years to pay back of all of its debts.
- LNTH's Debt to FCF ratio of 1.22 is amongst the best of the industry. LNTH outperforms 91.53% of its industry peers.
- Even though the debt/equity ratio score it not favorable for LNTH, it has very limited outstanding debt, so we won't put too much weight on the DE evaluation.
- LNTH has a Current Ratio of 5.52. This indicates that LNTH is financially healthy and has no problem in meeting its short term obligations.
- With a decent Current ratio value of 5.52, LNTH is doing good in the industry, outperforming 79.89% of the companies in the same industry.
- A Quick Ratio of 5.23 indicates that LNTH has no problem at all paying its short term obligations.
- LNTH has a Quick ratio of 5.23. This is amongst the best in the industry. LNTH outperforms 81.48% of its industry peers.
How do we evaluate the Profitability for LNTH?
ChartMill utilizes a Profitability Rating to assess stocks, scoring them on a scale of 0 to 10. This rating takes into account a variety of profitability ratios and margins, both in absolute terms and in comparison to industry peers. LNTH has earned a 9 out of 10:
- The Return On Assets of LNTH (15.78%) is better than 95.77% of its industry peers.
- The Return On Equity of LNTH (28.72%) is better than 97.88% of its industry peers.
- LNTH has a better Return On Invested Capital (19.59%) than 98.94% of its industry peers.
- The Average Return On Invested Capital over the past 3 years for LNTH is significantly above the industry average of 7.69%.
- The last Return On Invested Capital (19.59%) for LNTH is above the 3 year average (16.25%), which is a sign of increasing profitability.
- With an excellent Profit Margin value of 20.37%, LNTH belongs to the best of the industry, outperforming 94.18% of the companies in the same industry.
- LNTH's Profit Margin has improved in the last couple of years.
- LNTH has a Operating Margin of 29.24%. This is amongst the best in the industry. LNTH outperforms 97.88% of its industry peers.
- LNTH's Operating Margin has improved in the last couple of years.
- With a decent Gross Margin value of 64.43%, LNTH is doing good in the industry, outperforming 66.14% of the companies in the same industry.
- LNTH's Gross Margin has improved in the last couple of years.
Every day, new Affordable Growth stocks can be found on ChartMill in our Affordable Growth screener.
For an up to date full fundamental analysis you can check the fundamental report of LNTH
Disclaimer
Important Note: The content of this article is not intended as trading advice. It is essential to perform your own analysis and exercise caution when making trading decisions. The article presents observations created by automated analysis but does not guarantee any trading or investment outcomes. Always trade responsibly and make independent judgments.
102.7
+0.93 (+0.91%)
Find more stocks in the Stock Screener
LNTH Latest News and Analysis
 a minute ago - ChartmillIn the world of growth stocks, LANTHEUS HOLDINGS INC (NASDAQ:LNTH) shines as a value proposition.
LANTHEUS HOLDINGS INC could be undervalued. NASDAQ:LNTH is scoring impressively in terms of growth while demonstrating strong financials. On top of that, it remains attractively priced.
