Despite its impressive fundamentals, NASDAQ:LNTH remains undervalued.
By Mill Chart
Last update: Feb 21, 2025
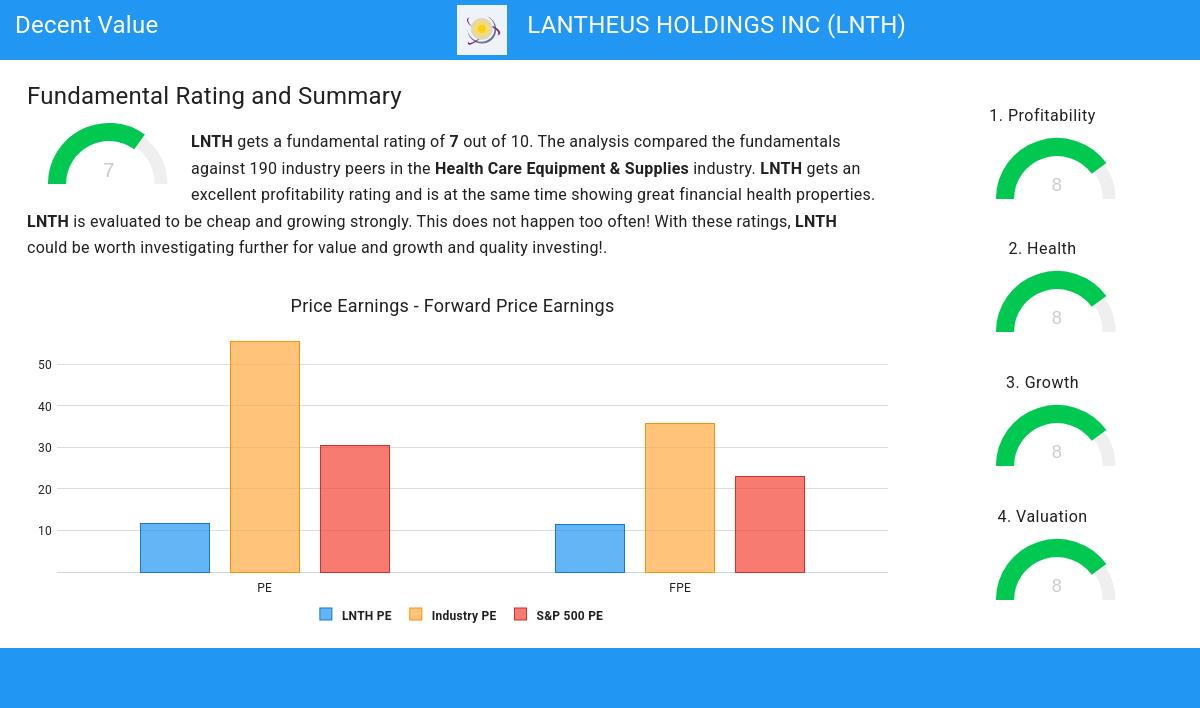
LANTHEUS HOLDINGS INC (NASDAQ:LNTH) was identified as a decent value stock by our stock screener. NASDAQ:LNTH scores well on profitability, solvency and liquidity. At the same time it seems to be priced very reasonably. We'll explore this a bit deeper below.
Valuation Analysis for NASDAQ:LNTH
To assess a stock's valuation, ChartMill utilizes a Valuation Rating on a scale of 0 to 10. This comprehensive assessment considers various valuation aspects, comparing price to earnings and cash flows, while factoring in profitability and growth. NASDAQ:LNTH has achieved a 8 out of 10:
- LNTH is valuated reasonably with a Price/Earnings ratio of 11.65.
- Based on the Price/Earnings ratio, LNTH is valued cheaply inside the industry as 95.21% of the companies are valued more expensively.
- Compared to an average S&P500 Price/Earnings ratio of 30.30, LNTH is valued rather cheaply.
- The Price/Forward Earnings ratio is 11.37, which indicates a very decent valuation of LNTH.
- LNTH's Price/Forward Earnings ratio is rather cheap when compared to the industry. LNTH is cheaper than 96.28% of the companies in the same industry.
- The average S&P500 Price/Forward Earnings ratio is at 23.06. LNTH is valued rather cheaply when compared to this.
- Based on the Enterprise Value to EBITDA ratio, LNTH is valued cheaper than 93.09% of the companies in the same industry.
- Compared to the rest of the industry, the Price/Free Cash Flow ratio of LNTH indicates a rather cheap valuation: LNTH is cheaper than 92.55% of the companies listed in the same industry.
- LNTH has an outstanding profitability rating, which may justify a higher PE ratio.
Profitability Analysis for NASDAQ:LNTH
ChartMill assigns a Profitability Rating to every stock. This score ranges from 0 to 10 and evaluates the different profitability ratios and margins, both absolutely, but also relative to the industry peers. NASDAQ:LNTH scores a 8 out of 10:
- Looking at the Return On Assets, with a value of 20.86%, LNTH belongs to the top of the industry, outperforming 97.87% of the companies in the same industry.
- The Return On Equity of LNTH (36.25%) is better than 98.40% of its industry peers.
- LNTH has a better Return On Invested Capital (29.79%) than 99.47% of its industry peers.
- With an excellent Profit Margin value of 28.57%, LNTH belongs to the best of the industry, outperforming 97.34% of the companies in the same industry.
- In the last couple of years the Profit Margin of LNTH has grown nicely.
- LNTH's Operating Margin of 31.69% is amongst the best of the industry. LNTH outperforms 98.94% of its industry peers.
- In the last couple of years the Operating Margin of LNTH has grown nicely.
- LNTH has a Gross Margin of 64.78%. This is in the better half of the industry: LNTH outperforms 67.02% of its industry peers.
- LNTH's Gross Margin has improved in the last couple of years.
Evaluating Health: NASDAQ:LNTH
ChartMill employs its own Health Rating for stock assessment. This rating, ranging from 0 to 10, is calculated by examining various liquidity and solvency ratios. In the case of NASDAQ:LNTH, the assigned 8 reflects its health status:
- An Altman-Z score of 5.98 indicates that LNTH is not in any danger for bankruptcy at the moment.
- LNTH has a better Altman-Z score (5.98) than 82.98% of its industry peers.
- The Debt to FCF ratio of LNTH is 1.49, which is an excellent value as it means it would take LNTH, only 1.49 years of fcf income to pay off all of its debts.
- LNTH's Debt to FCF ratio of 1.49 is amongst the best of the industry. LNTH outperforms 89.36% of its industry peers.
- LNTH has a Debt/Equity ratio of 0.00. This is a healthy value indicating a solid balance between debt and equity.
- LNTH has a better Debt to Equity ratio (0.00) than 68.09% of its industry peers.
- The current and quick ratio evaluation for LNTH is rather negative, while it does have excellent solvency and profitability. These ratios do not necessarly indicate liquidity issues and need to be evaluated against the specifics of the business.
Growth Examination for NASDAQ:LNTH
ChartMill employs its own Growth Rating system for all stocks. This score, ranging from 0 to 10, is derived by evaluating different growth factors, such as EPS and revenue growth, taking into account both past performance and future projections. NASDAQ:LNTH has earned a 8 for growth:
- LNTH shows a strong growth in Earnings Per Share. In the last year, the EPS has been growing by 18.63%, which is quite good.
- Measured over the past years, LNTH shows a very strong growth in Earnings Per Share. The EPS has been growing by 45.36% on average per year.
- Looking at the last year, LNTH shows a very strong growth in Revenue. The Revenue has grown by 24.15%.
- Measured over the past years, LNTH shows a very strong growth in Revenue. The Revenue has been growing by 30.43% on average per year.
- Based on estimates for the next years, LNTH will show a quite strong growth in Earnings Per Share. The EPS will grow by 13.05% on average per year.
- LNTH is expected to show quite a strong growth in Revenue. In the coming years, the Revenue will grow by 13.40% yearly.
More Decent Value stocks can be found in our Decent Value screener.
Check the latest full fundamental report of LNTH for a complete fundamental analysis.
Disclaimer
Important Note: The content of this article is not intended as trading advice. It is essential to perform your own analysis and exercise caution when making trading decisions. The article presents observations created by automated analysis but does not guarantee any trading or investment outcomes. Always trade responsibly and make independent judgments.
80.84
-0.55 (-0.68%)
Find more stocks in the Stock Screener
LNTH Latest News and Analysis
 2 minutes ago - ChartmillDespite its impressive fundamentals, NASDAQ:LNTH remains undervalued.
Uncover the potential of LANTHEUS HOLDINGS INC, an undervalued stock. NASDAQ:LNTH maintains a strong financial position and offers an appealing valuation.
