NASDAQ:LI is showing decent growth, but is still valued reasonably.
By Mill Chart
Last update: Feb 20, 2025
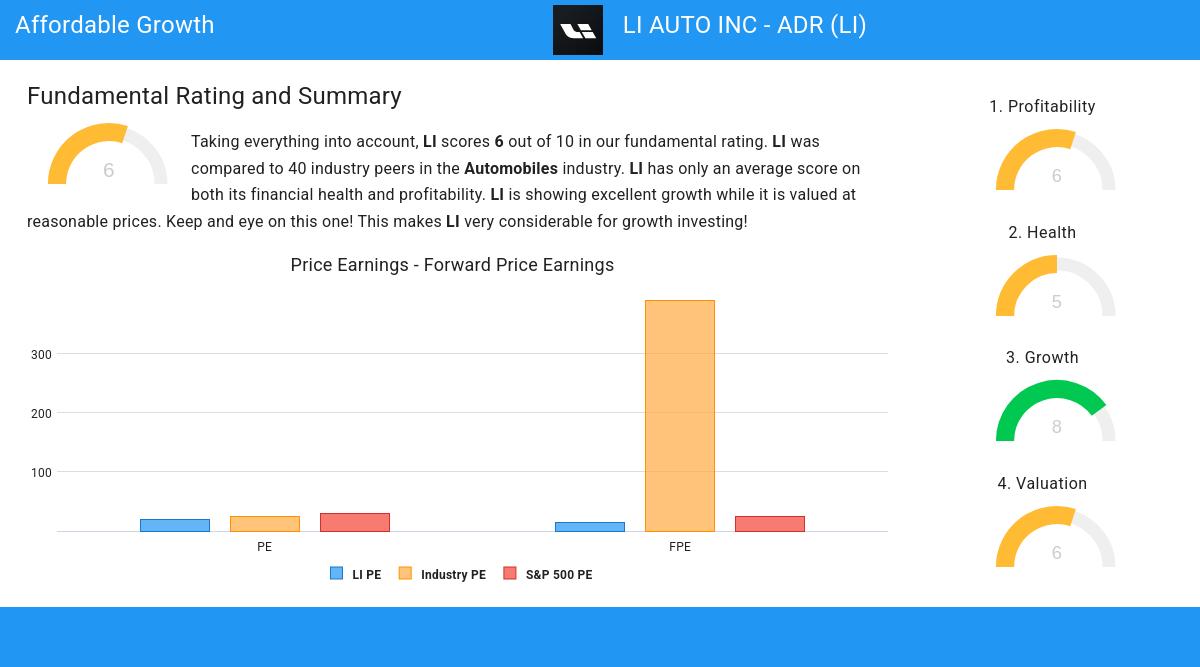
Our stock screening tool has pinpointed LI AUTO INC - ADR (NASDAQ:LI) as a growth stock that isn't overvalued. NASDAQ:LI is excelling in various growth indicators while maintaining a solid financial footing. Furthermore, it remains attractively priced. Let's delve into the specifics below.
Understanding NASDAQ:LI's Growth Score
ChartMill assigns a Growth Rating to every stock. This score ranges from 0 to 10 and evaluates the different growth aspects like EPS and Revenue, both in the past as in the future. NASDAQ:LI scores a 8 out of 10:
- The Earnings Per Share has grown by an impressive 59.14% over the past year.
- Looking at the last year, LI shows a very strong growth in Revenue. The Revenue has grown by 42.25%.
- The Revenue has been growing by 135.72% on average over the past years. This is a very strong growth!
- Based on estimates for the next years, LI will show a quite strong growth in Earnings Per Share. The EPS will grow by 8.56% on average per year.
- Based on estimates for the next years, LI will show a very strong growth in Revenue. The Revenue will grow by 20.25% on average per year.
Understanding NASDAQ:LI's Valuation
ChartMill provides a Valuation Rating to every stock, ranging from 0 to 10. This rating assesses various valuation aspects, comparing price to earnings and cash flows, while considering factors like profitability and growth. NASDAQ:LI boasts a 6 out of 10:
- Based on the Price/Earnings ratio, LI is valued a bit cheaper than 76.32% of the companies in the same industry.
- LI's Price/Earnings ratio indicates a valuation a bit cheaper than the S&P500 average which is at 30.42.
- Based on the Price/Forward Earnings ratio, LI is valued a bit cheaper than the industry average as 78.95% of the companies are valued more expensively.
- The average S&P500 Price/Forward Earnings ratio is at 23.75. LI is valued slightly cheaper when compared to this.
- Based on the Enterprise Value to EBITDA ratio, LI is valued cheaply inside the industry as 81.58% of the companies are valued more expensively.
- Based on the Price/Free Cash Flow ratio, LI is valued cheaply inside the industry as 94.74% of the companies are valued more expensively.
- LI has a very decent profitability rating, which may justify a higher PE ratio.
- LI's earnings are expected to grow with 20.01% in the coming years. This may justify a more expensive valuation.
Unpacking NASDAQ:LI's Health Rating
Every stock is evaluated by ChartMill, receiving a Health Rating on a scale of 0 to 10. This assessment considers different health aspects, including liquidity and solvency, both in absolute terms and relative to industry peers. NASDAQ:LI has achieved a 5 out of 10:
- The Debt to FCF ratio of LI is 0.39, which is an excellent value as it means it would take LI, only 0.39 years of fcf income to pay off all of its debts.
- LI's Debt to FCF ratio of 0.39 is amongst the best of the industry. LI outperforms 100.00% of its industry peers.
- A Debt/Equity ratio of 0.13 indicates that LI is not too dependend on debt financing.
- With a decent Debt to Equity ratio value of 0.13, LI is doing good in the industry, outperforming 78.95% of the companies in the same industry.
- Looking at the Current ratio, with a value of 1.76, LI is in the better half of the industry, outperforming 65.79% of the companies in the same industry.
- The Quick ratio of LI (1.64) is better than 78.95% of its industry peers.
Assessing Profitability for NASDAQ:LI
Discover ChartMill's exclusive Profitability Rating, a proprietary metric that assesses stocks on a scale of 0 to 10. It takes into consideration various profitability ratios and margins, both in absolute terms and relative to industry peers. Notably, NASDAQ:LI has achieved a 6:
- Looking at the Return On Assets, with a value of 6.57%, LI belongs to the top of the industry, outperforming 94.74% of the companies in the same industry.
- LI's Return On Equity of 15.27% is amongst the best of the industry. LI outperforms 89.47% of its industry peers.
- LI's Return On Invested Capital of 5.78% is amongst the best of the industry. LI outperforms 84.21% of its industry peers.
- LI's Profit Margin of 7.16% is amongst the best of the industry. LI outperforms 84.21% of its industry peers.
- The Operating Margin of LI (4.48%) is better than 78.95% of its industry peers.
- LI has a better Gross Margin (21.47%) than 81.58% of its industry peers.
- In the last couple of years the Gross Margin of LI has grown nicely.
Our Affordable Growth screener lists more Affordable Growth stocks and is updated daily.
For an up to date full fundamental analysis you can check the fundamental report of LI
Keep in mind
This is not investing advice! The article highlights some of the observations at the time of writing, but you should always make your own analysis and invest based on your own insights.
26.46
+0.83 (+3.24%)
Find more stocks in the Stock Screener
LI Latest News and Analysis
 3 hours ago - ChartmillNASDAQ:LI is showing decent growth, but is still valued reasonably.
LI AUTO INC - ADR was identified as a growth stock that isn't overvalued. NASDAQ:LI is excelling in various growth indicators while maintaining a solid financial footing.
 2 days ago - ChartmillExploring the Growth Potential of NASDAQ:LI as It Nears a Breakout.
Based on fundamental and technical analysis of NASDAQ:LI we conclude: LI AUTO INC - ADR (NASDAQ:LI): a strong growth stock preparing for the next leg up?.
