NASDAQ:LAUR stands out as a stock that provides good value for the fundamentals it showcases.
By Mill Chart
Last update: Feb 17, 2025
Discover LAUREATE EDUCATION INC (NASDAQ:LAUR), an undervalued stock highlighted by our stock screener. NASDAQ:LAUR showcases solid financial health and profitability while maintaining an appealing valuation. We'll explore the details.
What does the Valuation looks like for NASDAQ:LAUR
ChartMill assigns a Valuation Rating to each stock, ranging from 0 to 10. This rating is calculated by analyzing different valuation elements, such as price to earnings and free cash flow, both in absolute terms and relative to the market and industry. In the case of NASDAQ:LAUR, the assigned 9 reflects its valuation:
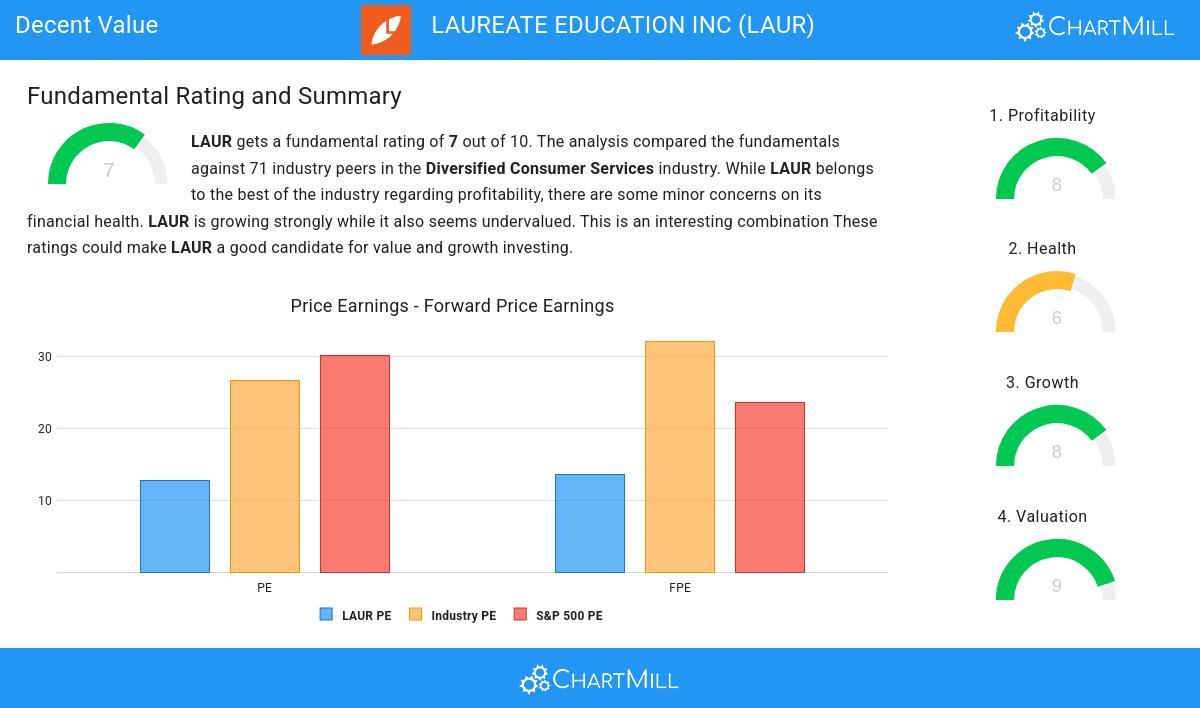
- LAUR's Price/Earnings ratio is rather cheap when compared to the industry. LAUR is cheaper than 89.06% of the companies in the same industry.
- LAUR is valuated cheaply when we compare the Price/Earnings ratio to 30.11, which is the current average of the S&P500 Index.
- 85.94% of the companies in the same industry are more expensive than LAUR, based on the Price/Forward Earnings ratio.
- LAUR's Price/Forward Earnings ratio indicates a valuation a bit cheaper than the S&P500 average which is at 23.58.
- LAUR's Enterprise Value to EBITDA ratio is rather cheap when compared to the industry. LAUR is cheaper than 84.38% of the companies in the same industry.
- Based on the Price/Free Cash Flow ratio, LAUR is valued cheaper than 84.38% of the companies in the same industry.
- The low PEG Ratio(NY), which compensates the Price/Earnings for growth, indicates a rather cheap valuation of the company.
- The excellent profitability rating of LAUR may justify a higher PE ratio.
- LAUR's earnings are expected to grow with 37.83% in the coming years. This may justify a more expensive valuation.
Exploring NASDAQ:LAUR's Profitability
ChartMill's Profitability Rating offers a unique perspective on stock analysis, providing scores from 0 to 10. These ratings consider a wide range of profitability metrics and margins, both in comparison to industry peers and on their own merits. For NASDAQ:LAUR, the assigned 8 is a significant indicator of profitability:
- LAUR has a better Return On Assets (12.70%) than 89.06% of its industry peers.
- LAUR has a better Return On Equity (27.26%) than 89.06% of its industry peers.
- Looking at the Return On Invested Capital, with a value of 18.83%, LAUR belongs to the top of the industry, outperforming 92.19% of the companies in the same industry.
- The 3 year average ROIC (10.83%) for LAUR is below the current ROIC(18.83%), indicating increased profibility in the last year.
- LAUR has a Profit Margin of 15.76%. This is amongst the best in the industry. LAUR outperforms 89.06% of its industry peers.
- LAUR's Operating Margin of 23.26% is amongst the best of the industry. LAUR outperforms 92.19% of its industry peers.
- LAUR's Operating Margin has improved in the last couple of years.
- LAUR's Gross Margin has improved in the last couple of years.
A Closer Look at Health for NASDAQ:LAUR
To gauge a stock's financial health, ChartMill utilizes a Health Rating on a scale of 0 to 10. This comprehensive evaluation encompasses liquidity and solvency, both in absolute terms and in comparison to industry peers. NASDAQ:LAUR has earned a 6 out of 10:
- An Altman-Z score of 3.24 indicates that LAUR is not in any danger for bankruptcy at the moment.
- LAUR's Altman-Z score of 3.24 is fine compared to the rest of the industry. LAUR outperforms 79.69% of its industry peers.
- The Debt to FCF ratio of LAUR is 0.80, which is an excellent value as it means it would take LAUR, only 0.80 years of fcf income to pay off all of its debts.
- Looking at the Debt to FCF ratio, with a value of 0.80, LAUR belongs to the top of the industry, outperforming 82.81% of the companies in the same industry.
- A Debt/Equity ratio of 0.14 indicates that LAUR is not too dependend on debt financing.
- The current and quick ratio evaluation for LAUR is rather negative, while it does have excellent solvency and profitability. These ratios do not necessarly indicate liquidity issues and need to be evaluated against the specifics of the business.
How We Gauge Growth for NASDAQ:LAUR
A key component of ChartMill's stock assessment is the Growth Rating, which spans from 0 to 10. This rating evaluates diverse growth factors, such as EPS and revenue growth, considering both past performance and future projections. NASDAQ:LAUR has received a 8 out of 10:
- LAUR shows a strong growth in Earnings Per Share. In the last year, the EPS has been growing by 139.39%, which is quite impressive.
- Measured over the past years, LAUR shows a very strong growth in Earnings Per Share. The EPS has been growing by 24.06% on average per year.
- LAUR shows quite a strong growth in Revenue. In the last year, the Revenue has grown by 9.25%.
- LAUR is expected to show a strong growth in Earnings Per Share. In the coming years, the EPS will grow by 37.83% yearly.
- The Revenue is expected to grow by 9.38% on average over the next years. This is quite good.
- When comparing the EPS growth rate of the last years to the growth rate of the upcoming years, we see that the growth is accelerating.
- The Revenue growth rate is accelerating: in the next years the growth will be better than in the last years.
Our Decent Value screener lists more Decent Value stocks and is updated daily.
Our latest full fundamental report of LAUR contains the most current fundamental analsysis.
Disclaimer
This is not investing advice! The article highlights some of the observations at the time of writing, but you should always make your own analysis and invest based on your own insights.
NASDAQ:LAUR (2/19/2025, 1:12:47 PM)
20.11
-0.19 (-0.94%)
Find more stocks in the Stock Screener
LAUR Latest News and Analysis
 2 days ago - ChartmillNASDAQ:LAUR stands out as a stock that provides good value for the fundamentals it showcases.
Discover LAUREATE EDUCATION INC, an undervalued stock. NASDAQ:LAUR showcases solid financial health and profitability while maintaining an appealing valuation.
 2 days ago - ChartmillNASDAQ:LAUR stands out as a growth opportunity that won't break the bank.
Discover LAUREATE EDUCATION INC, an undervalued growth gem. NASDAQ:LAUR is shining in terms of growth metrics, and it's also displaying strong financial health and profitability, retaining an appealing valuation.
