Investors seeking growth at a reasonable cost should explore NASDAQ:KLAC.
By Mill Chart
Last update: Feb 24, 2025
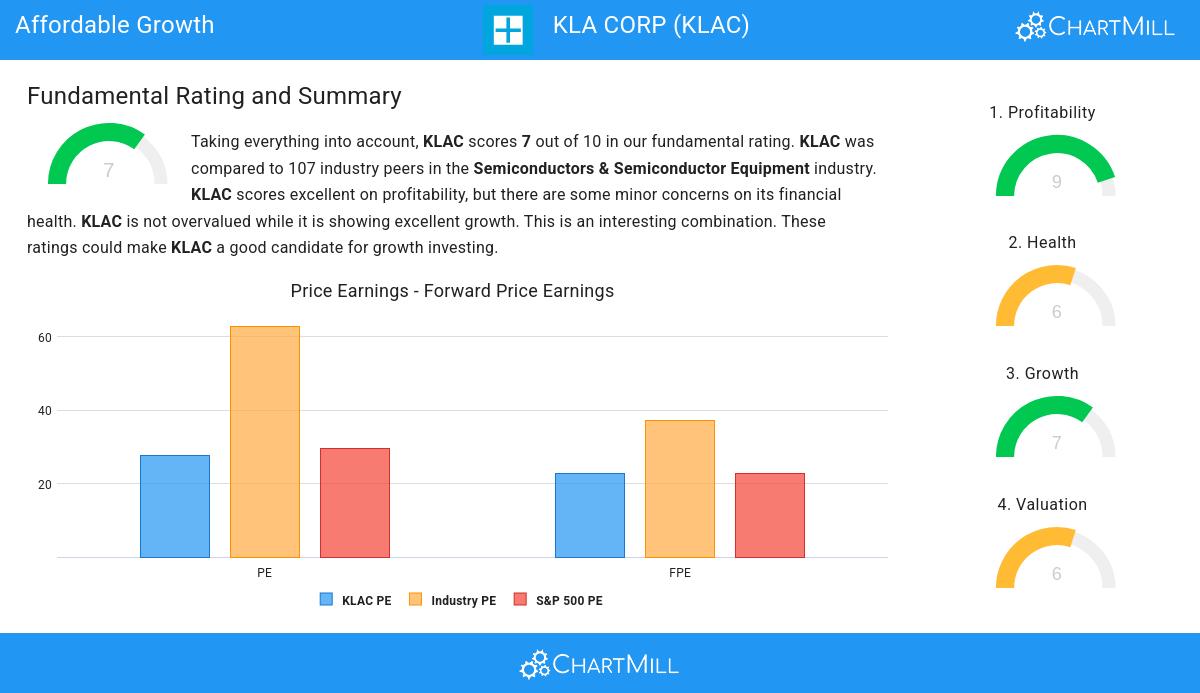
KLA CORP (NASDAQ:KLAC) was identified as an affordable growth stock by our stock screener. NASDAQ:KLAC is showing great growth, but also scores well on profitability, solvency and liquidity. At the same time it seems to be priced reasonably. We'll explore this a bit deeper below.
Growth Assessment of NASDAQ:KLAC
Every stock receives a Growth Rating from ChartMill, ranging from 0 to 10. This rating assesses various growth aspects, including historical and projected EPS and revenue growth. NASDAQ:KLAC boasts a 7 out of 10:
- KLAC shows a strong growth in Earnings Per Share. In the last year, the EPS has been growing by 20.18%, which is quite impressive.
- KLAC shows a strong growth in Earnings Per Share. Measured over the last years, the EPS has been growing by 22.88% yearly.
- Looking at the last year, KLAC shows a quite strong growth in Revenue. The Revenue has grown by 12.15% in the last year.
- KLAC shows quite a strong growth in Revenue. Measured over the last years, the Revenue has been growing by 16.52% yearly.
- The Earnings Per Share is expected to grow by 13.95% on average over the next years. This is quite good.
- The Revenue is expected to grow by 9.68% on average over the next years. This is quite good.
Valuation Examination for NASDAQ:KLAC
To assess a stock's valuation, ChartMill utilizes a Valuation Rating on a scale of 0 to 10. This comprehensive assessment considers various valuation aspects, comparing price to earnings and cash flows, while factoring in profitability and growth. NASDAQ:KLAC has achieved a 6 out of 10:
- Based on the Price/Earnings ratio, KLAC is valued a bit cheaper than the industry average as 70.09% of the companies are valued more expensively.
- Based on the Price/Forward Earnings ratio, KLAC is valued a bit cheaper than 74.77% of the companies in the same industry.
- Based on the Enterprise Value to EBITDA ratio, KLAC is valued a bit cheaper than 69.16% of the companies in the same industry.
- KLAC's Price/Free Cash Flow ratio is rather cheap when compared to the industry. KLAC is cheaper than 81.31% of the companies in the same industry.
- The low PEG Ratio(NY), which compensates the Price/Earnings for growth, indicates a rather cheap valuation of the company.
- The excellent profitability rating of KLAC may justify a higher PE ratio.
- A more expensive valuation may be justified as KLAC's earnings are expected to grow with 17.20% in the coming years.
What does the Health looks like for NASDAQ:KLAC
ChartMill employs a unique Health Rating system for all stocks. This rating, ranging from 0 to 10, is determined by analyzing various liquidity and solvency ratios. For NASDAQ:KLAC, the assigned 6 for health provides valuable insights:
- KLAC has an Altman-Z score of 7.51. This indicates that KLAC is financially healthy and has little risk of bankruptcy at the moment.
- The Altman-Z score of KLAC (7.51) is better than 71.03% of its industry peers.
- KLAC has a debt to FCF ratio of 1.75. This is a very positive value and a sign of high solvency as it would only need 1.75 years to pay back of all of its debts.
- Looking at the Debt to FCF ratio, with a value of 1.75, KLAC is in the better half of the industry, outperforming 72.90% of the companies in the same industry.
- Even though the debt/equity ratio score it not favorable for KLAC, it has very limited outstanding debt, so we won't put too much weight on the DE evaluation.
- KLAC has a Current Ratio of 2.36. This indicates that KLAC is financially healthy and has no problem in meeting its short term obligations.
A Closer Look at Profitability for NASDAQ:KLAC
ChartMill assigns a Profitability Rating to every stock. This score ranges from 0 to 10 and evaluates the different profitability ratios and margins, both absolutely, but also relative to the industry peers. NASDAQ:KLAC scores a 9 out of 10:
- KLAC has a Return On Assets of 21.39%. This is amongst the best in the industry. KLAC outperforms 95.33% of its industry peers.
- The Return On Equity of KLAC (89.51%) is better than 98.13% of its industry peers.
- With an excellent Return On Invested Capital value of 35.07%, KLAC belongs to the best of the industry, outperforming 98.13% of the companies in the same industry.
- Measured over the past 3 years, the Average Return On Invested Capital for KLAC is significantly above the industry average of 11.67%.
- The 3 year average ROIC (33.80%) for KLAC is below the current ROIC(35.07%), indicating increased profibility in the last year.
- With an excellent Profit Margin value of 29.58%, KLAC belongs to the best of the industry, outperforming 91.59% of the companies in the same industry.
- In the last couple of years the Profit Margin of KLAC has grown nicely.
- The Operating Margin of KLAC (39.92%) is better than 97.20% of its industry peers.
- KLAC's Operating Margin has improved in the last couple of years.
- With an excellent Gross Margin value of 61.37%, KLAC belongs to the best of the industry, outperforming 86.92% of the companies in the same industry.
Every day, new Affordable Growth stocks can be found on ChartMill in our Affordable Growth screener.
Our latest full fundamental report of KLAC contains the most current fundamental analsysis.
Keep in mind
This is not investing advice! The article highlights some of the observations at the time of writing, but you should always make your own analysis and invest based on your own insights.
687.95
-5.77 (-0.83%)
Find more stocks in the Stock Screener
KLAC Latest News and Analysis
 14 days ago - ChartmillStay informed with the top movers within the S&P500 index on Wednesday.
Let's delve into the developments on the US markets one hour before the close of the markets on Wednesday. Below, you'll find the top gainers and losers within the S&P500 index during today's session.
14 days ago - ChartmillDiscover which S&P500 stocks are making waves on Wednesday.Let's delve into the developments on the US markets in the middle of the day on Wednesday. Below, you'll find the top gainers and losers within the S&P500 index during today's session.
 14 days ago - ChartmillWednesday's session: gap up and gap down stock in the S&P500 index
Let's take a look at the S&P500 stocks that are experiencing notable price gaps in today's session on Wednesday. Discover the gap up and gap down stocks in the S&P500 index.
 19 days ago - ChartmillKLA CORP (NASDAQ:KLAC) stands out as a growth opportunity that won't break the bank.
NASDAQ:KLAC is scoring great on several growth aspects while it also shows decent health and profitability. At the same time it remains remains attractively priced.
