
In-Depth Technical Analysis of KKR & CO INC.
By Mill Chart
Last update: Sep 16, 2024
Our stock screener has flagged KKR & CO INC (NYSE:KKR) as a potential breakout candidate. This occurs when the stock shows signs of consolidation after a notable upward trend. While we can't predict the actual breakout, it's worth monitoring NYSE:KKR for potential movement.
In-Depth Technical Analysis of NYSE:KKR
ChartMill assigns a proprietary Technical Rating to each stock. The score is computed daily by evaluating various technical indicators and properties. The score ranges from 0 to 10.
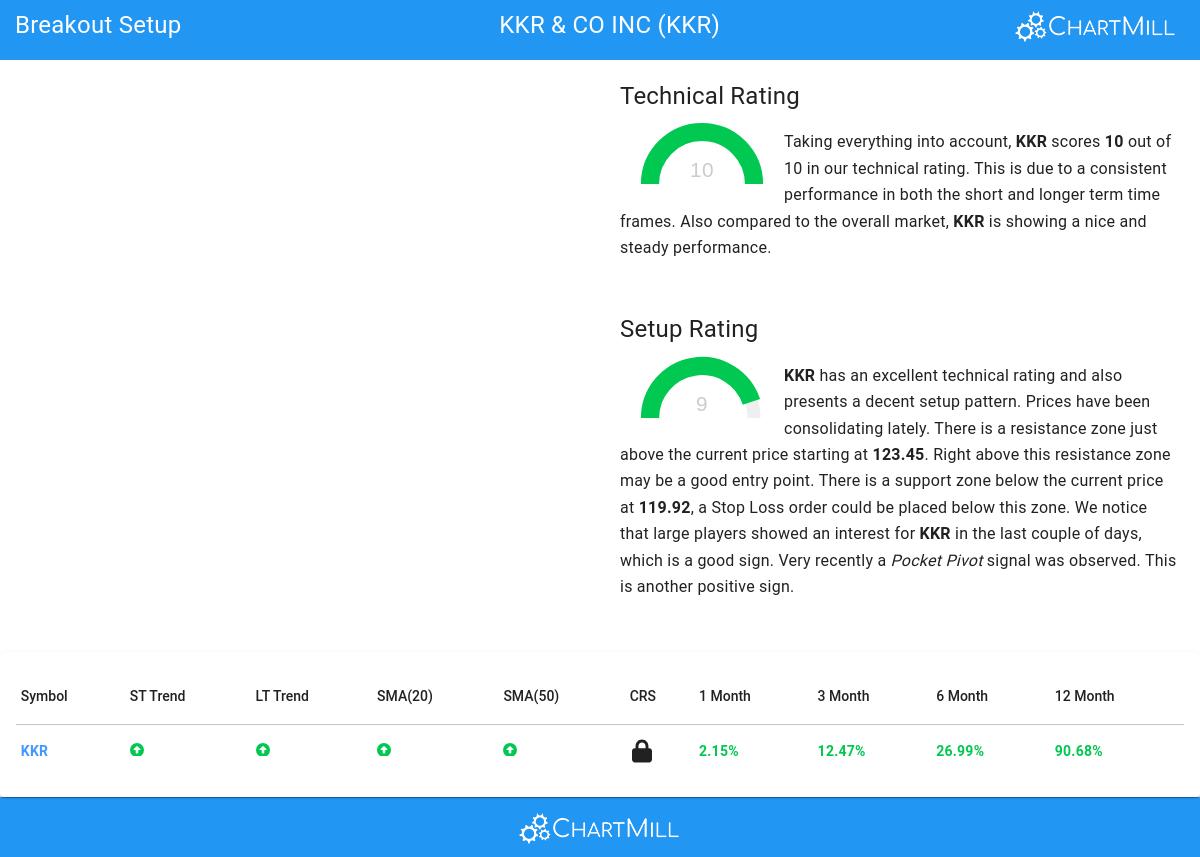
Taking everything into account, KKR scores 10 out of 10 in our technical rating. Both in the recent history as in the last year, KKR has proven to be a steady performer, scoring decent points in every aspect analyzed.
- Both the short term and long term trends are positive. This is a very positive sign.
- Looking at the yearly performance, KKR did better than 94% of all other stocks. On top of that, KKR also shows a nice and consistent pattern of rising prices.
- KKR is part of the Capital Markets industry. There are 219 other stocks in this industry. KKR outperforms 97% of them.
- KKR is currently trading near its 52 week high, which is a good sign. The S&P500 Index however is also trading near new highs, which makes the performance in line with the market.
- In the last month KKR has a been trading in the 113.92 - 124.20 range, which is quite wide. It is currently trading near the high of this range.
Check the latest full technical report of KKR for a complete technical analysis.
Why is NYSE:KKR a setup?
ChartMill also assign a Setup Rating to every stock. With this score it is determined to what extend the stock has been trading in a range in the recent days and weeks. This score also ranges from 0 to 10 and is updated daily. The setup score evaluates various short term technical indicators. NYSE:KKR scores a 9 out of 10:
Besides having an excellent technical rating, KKR also presents a decent setup pattern. Prices have been consolidating lately. There is a resistance zone just above the current price starting at 123.45. Right above this resistance zone may be a good entry point. There is a support zone below the current price at 119.92, a Stop Loss order could be placed below this zone. We notice that large players showed an interest for KKR in the last couple of days, which is a good sign. Very recently a Pocket Pivot signal was observed. This is another positive sign.
Trading setups like NYSE:KKR
A breakout opportunity may arise when the stock surpasses the current consolidation zone and reaches new highs. Traders often wait for this breakout before considering buying the stock. To manage risk, a stop loss order could be placed below the consolidation zone to limit potential losses.
Disclaimer: This article is not intended to provide trading advice. It is crucial to conduct your own analysis and consider your own observations and trading style when making investment decisions. The article solely presents technical observations and should not be relied upon as a sole basis for trading.
More breakout setups can be found in our Breakout screener.
Disclaimer
This article should in no way be interpreted as advice. The article is based on the observed metrics at the time of writing, but you should always make your own analysis and trade or invest at your own responsibility.
136.6
-6.17 (-4.32%)
Find more stocks in the Stock Screener
KKR Latest News and Analysis

