Is HUNT (JB) TRANSPRT SVCS INC (NASDAQ:JBHT) suited for dividend investing?
By Mill Chart
Last update: Mar 8, 2025
Our stock screener has singled out HUNT (JB) TRANSPRT SVCS INC (NASDAQ:JBHT) as a promising choice for dividend investors. NASDAQ:JBHT not only scores well in profitability, solvency, and liquidity but also offers a decent dividend. We'll explore this further.
What does the Dividend looks like for NASDAQ:JBHT
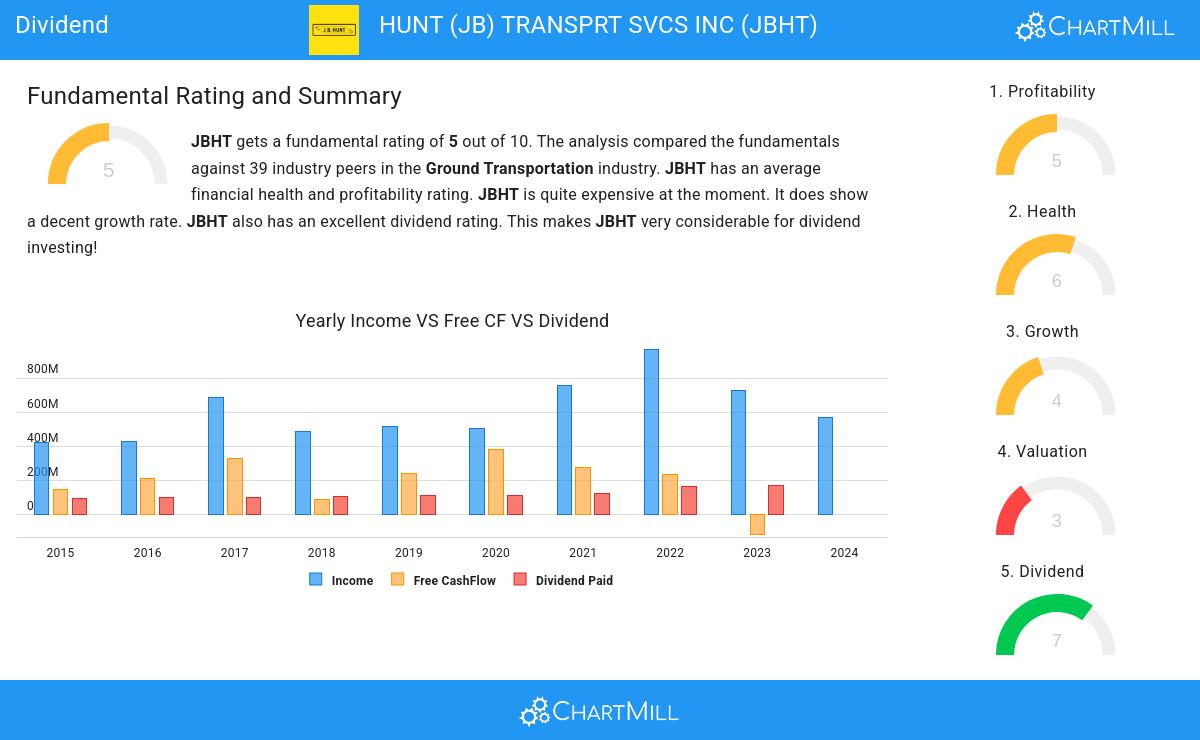
ChartMill assigns a Dividend Rating to every stock. This score ranges from 0 to 10 and evaluates the different dividend aspects, including the yield, the growth and sustainability. NASDAQ:JBHT scores a 7 out of 10:
- Compared to an average industry Dividend Yield of 1.48, JBHT pays a bit more dividend than its industry peers.
- On average, the dividend of JBHT grows each year by 11.83%, which is quite nice.
- JBHT has paid a dividend for at least 10 years, which is a reliable track record.
- JBHT has not decreased their dividend for at least 10 years, which is a reliable track record.
- JBHT pays out 30.85% of its income as dividend. This is a sustainable payout ratio.
- The dividend of JBHT is growing, but earnings are growing more, so the dividend growth is sustainable.
A Closer Look at Health for NASDAQ:JBHT
ChartMill assigns a Health Rating to every stock. This score ranges from 0 to 10 and evaluates the different health aspects like liquidity and solvency, both absolutely, but also relative to the industry peers. NASDAQ:JBHT scores a 6 out of 10:
- JBHT has an Altman-Z score of 5.27. This indicates that JBHT is financially healthy and has little risk of bankruptcy at the moment.
- JBHT's Altman-Z score of 5.27 is amongst the best of the industry. JBHT outperforms 89.74% of its industry peers.
- The Debt to FCF ratio of JBHT is 3.52, which is a good value as it means it would take JBHT, 3.52 years of fcf income to pay off all of its debts.
- JBHT's Debt to FCF ratio of 3.52 is fine compared to the rest of the industry. JBHT outperforms 76.92% of its industry peers.
- JBHT has a Debt/Equity ratio of 0.26. This is a healthy value indicating a solid balance between debt and equity.
- JBHT has a better Debt to Equity ratio (0.26) than 64.10% of its industry peers.
Analyzing Profitability Metrics
ChartMill assigns a Profitability Rating to every stock. This score ranges from 0 to 10 and evaluates the different profitability ratios and margins, both absolutely, but also relative to the industry peers. NASDAQ:JBHT scores a 5 out of 10:
- Looking at the Return On Assets, with a value of 6.83%, JBHT is in the better half of the industry, outperforming 69.23% of the companies in the same industry.
- JBHT's Return On Equity of 14.22% is fine compared to the rest of the industry. JBHT outperforms 61.54% of its industry peers.
- JBHT's Return On Invested Capital of 10.08% is fine compared to the rest of the industry. JBHT outperforms 79.49% of its industry peers.
- JBHT had an Average Return On Invested Capital over the past 3 years of 12.43%. This is above the industry average of 7.75%.
Our Best Dividend screener lists more Best Dividend stocks and is updated daily.
For an up to date full fundamental analysis you can check the fundamental report of JBHT
Disclaimer
This article should in no way be interpreted as advice. The article is based on the observed metrics at the time of writing, but you should always make your own analysis and trade or invest at your own responsibility.
163.45
+1.19 (+0.73%)
Find more stocks in the Stock Screener
JBHT Latest News and Analysis
 22 hours ago - ChartmillIs HUNT (JB) TRANSPRT SVCS INC (NASDAQ:JBHT) suited for dividend investing?
Why HUNT (JB) TRANSPRT SVCS INC (NASDAQ:JBHT) provides a good dividend, while having solid fundamentals.
 18 days ago - ChartmillWhat's going on in today's session: S&P500 movers
Uncover the latest developments among S&P500 stocks in today's session. Stay tuned to the S&P500 index's top gainers and losers on Wednesday.
