
Investors should take note of NASDAQ:INTU, a growth stock that remains attractively priced.
By Mill Chart
Last update: Feb 4, 2025
Take a closer look at INTUIT INC (NASDAQ:INTU), an affordable growth stock uncovered by our stock screener. NASDAQ:INTU boasts strong growth prospects and excels in financial health indicators, all while maintaining a reasonable valuation. Let's break it down further.
Evaluating Growth: NASDAQ:INTU
Every stock receives a Growth Rating from ChartMill, ranging from 0 to 10. This rating assesses various growth aspects, including historical and projected EPS and revenue growth. NASDAQ:INTU boasts a 7 out of 10:
- The Earnings Per Share has grown by an nice 11.55% over the past year.
- INTU shows a strong growth in Earnings Per Share. Measured over the last years, the EPS has been growing by 20.25% yearly.
- INTU shows quite a strong growth in Revenue. In the last year, the Revenue has grown by 12.48%.
- INTU shows quite a strong growth in Revenue. Measured over the last years, the Revenue has been growing by 19.14% yearly.
- Based on estimates for the next years, INTU will show a quite strong growth in Earnings Per Share. The EPS will grow by 16.61% on average per year.
- The Revenue is expected to grow by 13.64% on average over the next years. This is quite good.
Understanding NASDAQ:INTU's Valuation Score
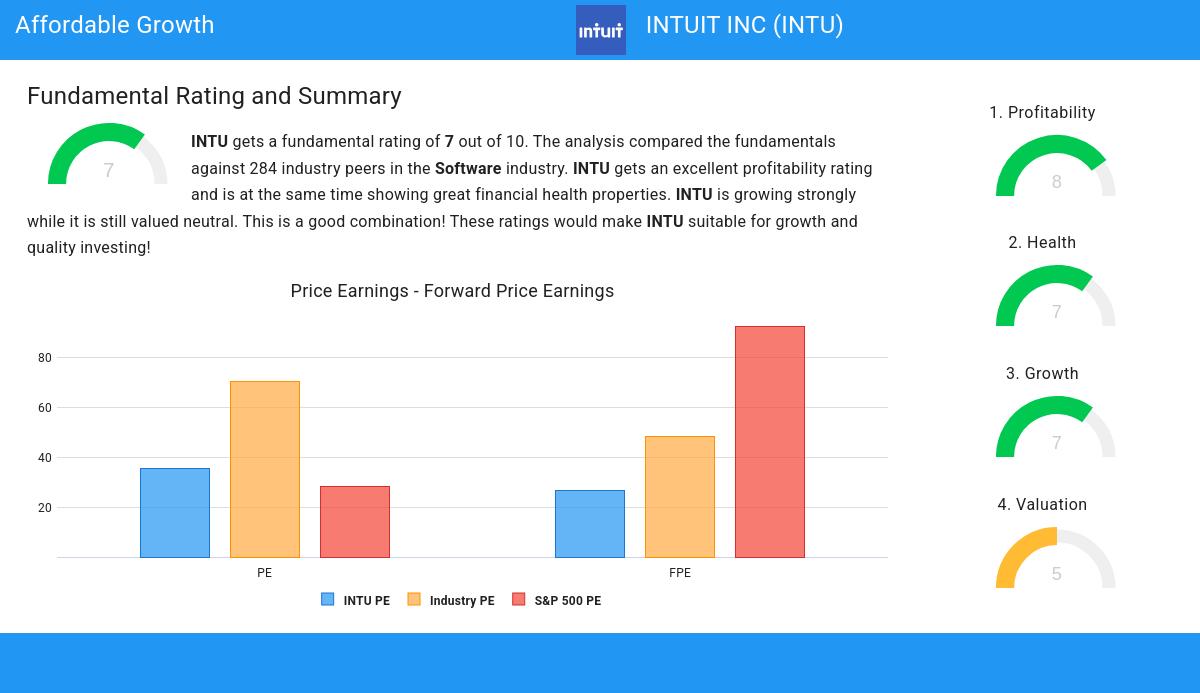
ChartMill assigns a proprietary Valuation Rating to each stock. The score is computed by evaluating various valuation aspects, like price to earnings and free cash flow, both absolutely as relative to the market and industry. NASDAQ:INTU was assigned a score of 5 for valuation:
- 68.95% of the companies in the same industry are more expensive than INTU, based on the Price/Earnings ratio.
- Based on the Price/Forward Earnings ratio, INTU is valued a bit cheaper than the industry average as 74.37% of the companies are valued more expensively.
- The average S&P500 Price/Forward Earnings ratio is at 92.49. INTU is valued rather cheaply when compared to this.
- Based on the Enterprise Value to EBITDA ratio, INTU is valued a bit cheaper than the industry average as 72.92% of the companies are valued more expensively.
- Compared to the rest of the industry, the Price/Free Cash Flow ratio of INTU indicates a somewhat cheap valuation: INTU is cheaper than 75.81% of the companies listed in the same industry.
- The excellent profitability rating of INTU may justify a higher PE ratio.
- INTU's earnings are expected to grow with 15.14% in the coming years. This may justify a more expensive valuation.
How We Gauge Health for NASDAQ:INTU
ChartMill assigns a proprietary Health Rating to each stock. The score is computed by evaluating various liquidity and solvency ratios and ranges from 0 to 10. NASDAQ:INTU was assigned a score of 7 for health:
- An Altman-Z score of 8.37 indicates that INTU is not in any danger for bankruptcy at the moment.
- INTU has a Altman-Z score of 8.37. This is in the better half of the industry: INTU outperforms 76.17% of its industry peers.
- The Debt to FCF ratio of INTU is 1.19, which is an excellent value as it means it would take INTU, only 1.19 years of fcf income to pay off all of its debts.
- Looking at the Debt to FCF ratio, with a value of 1.19, INTU is in the better half of the industry, outperforming 70.40% of the companies in the same industry.
- A Debt/Equity ratio of 0.31 indicates that INTU is not too dependend on debt financing.
- Although INTU does not score too well on debt/equity it has very limited outstanding debt, which is well covered by the FCF. We will not put too much weight on the debt/equity number as it may be because of low equity, which could be a consequence of a share buyback program for instance. This needs to be investigated.
- The current and quick ratio evaluation for INTU is rather negative, while it does have excellent solvency and profitability. These ratios do not necessarly indicate liquidity issues and need to be evaluated against the specifics of the business.
Understanding NASDAQ:INTU's Profitability
Discover ChartMill's exclusive Profitability Rating, a proprietary metric that assesses stocks on a scale of 0 to 10. It takes into consideration various profitability ratios and margins, both in absolute terms and relative to industry peers. Notably, NASDAQ:INTU has achieved a 8:
- INTU has a Return On Assets of 8.79%. This is amongst the best in the industry. INTU outperforms 84.84% of its industry peers.
- INTU's Return On Equity of 16.10% is amongst the best of the industry. INTU outperforms 84.84% of its industry peers.
- Looking at the Return On Invested Capital, with a value of 12.71%, INTU belongs to the top of the industry, outperforming 89.53% of the companies in the same industry.
- The last Return On Invested Capital (12.71%) for INTU is above the 3 year average (10.72%), which is a sign of increasing profitability.
- INTU has a Profit Margin of 17.59%. This is amongst the best in the industry. INTU outperforms 83.75% of its industry peers.
- With an excellent Operating Margin value of 23.06%, INTU belongs to the best of the industry, outperforming 90.61% of the companies in the same industry.
- The Gross Margin of INTU (78.73%) is better than 75.81% of its industry peers.
Every day, new Affordable Growth stocks can be found on ChartMill in our Affordable Growth screener.
Check the latest full fundamental report of INTU for a complete fundamental analysis.
Keep in mind
Important Note: The content of this article is not intended as trading advice. It is essential to perform your own analysis and exercise caution when making trading decisions. The article presents observations created by automated analysis but does not guarantee any trading or investment outcomes. Always trade responsibly and make independent judgments.