
Don't overlook HARMONY BIOSCIENCES HOLDINGS (NASDAQ:HRMY)—it's a hidden gem with strong fundamentals and an attractive price tag.
By Mill Chart
Last update: Feb 27, 2025
HARMONY BIOSCIENCES HOLDINGS (NASDAQ:HRMY) was identified as a decent value stock by our stock screener. NASDAQ:HRMY scores well on profitability, solvency and liquidity. At the same time it seems to be priced very reasonably. We'll explore this a bit deeper below.
Assessing Valuation Metrics for NASDAQ:HRMY
ChartMill assigns a Valuation Rating to each stock, ranging from 0 to 10. This rating is calculated by analyzing different valuation elements, such as price to earnings and free cash flow, both in absolute terms and relative to the market and industry. In the case of NASDAQ:HRMY, the assigned 9 reflects its valuation:
- HRMY's Price/Earnings ratio is rather cheap when compared to the industry. HRMY is cheaper than 89.67% of the companies in the same industry.
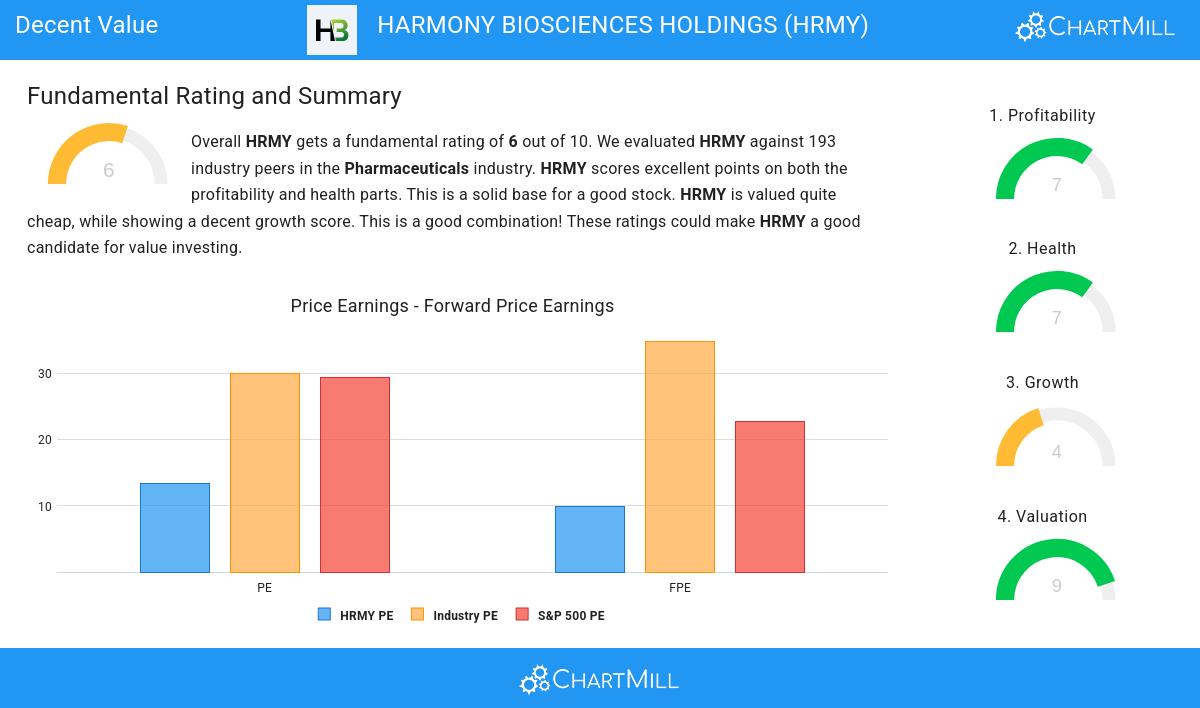
- The average S&P500 Price/Earnings ratio is at 29.36. HRMY is valued rather cheaply when compared to this.
- The Price/Forward Earnings ratio is 9.91, which indicates a very decent valuation of HRMY.
- Based on the Price/Forward Earnings ratio, HRMY is valued cheaply inside the industry as 87.50% of the companies are valued more expensively.
- HRMY's Price/Forward Earnings ratio indicates a rather cheap valuation when compared to the S&P500 average which is at 22.65.
- Compared to the rest of the industry, the Enterprise Value to EBITDA ratio of HRMY indicates a rather cheap valuation: HRMY is cheaper than 89.13% of the companies listed in the same industry.
- Based on the Price/Free Cash Flow ratio, HRMY is valued cheaply inside the industry as 92.39% of the companies are valued more expensively.
- HRMY's low PEG Ratio(NY), which compensates the Price/Earnings for growth, indicates a rather cheap valuation of the company.
- The decent profitability rating of HRMY may justify a higher PE ratio.
- HRMY's earnings are expected to grow with 48.08% in the coming years. This may justify a more expensive valuation.
What does the Profitability looks like for NASDAQ:HRMY
ChartMill assigns a Profitability Rating to every stock. This score ranges from 0 to 10 and evaluates the different profitability ratios and margins, both absolutely, but also relative to the industry peers. NASDAQ:HRMY scores a 7 out of 10:
- Looking at the Return On Assets, with a value of 13.21%, HRMY belongs to the top of the industry, outperforming 96.74% of the companies in the same industry.
- The Return On Equity of HRMY (20.55%) is better than 93.48% of its industry peers.
- With an excellent Return On Invested Capital value of 18.64%, HRMY belongs to the best of the industry, outperforming 94.57% of the companies in the same industry.
- The last Return On Invested Capital (18.64%) for HRMY is above the 3 year average (18.06%), which is a sign of increasing profitability.
- HRMY's Profit Margin of 17.98% is amongst the best of the industry. HRMY outperforms 90.76% of its industry peers.
- HRMY has a better Operating Margin (28.21%) than 92.39% of its industry peers.
- HRMY's Operating Margin has improved in the last couple of years.
- HRMY has a Gross Margin of 78.65%. This is amongst the best in the industry. HRMY outperforms 83.70% of its industry peers.
Evaluating Health: NASDAQ:HRMY
Every stock is evaluated by ChartMill, receiving a Health Rating on a scale of 0 to 10. This assessment considers different health aspects, including liquidity and solvency, both in absolute terms and relative to industry peers. NASDAQ:HRMY has achieved a 7 out of 10:
- An Altman-Z score of 5.27 indicates that HRMY is not in any danger for bankruptcy at the moment.
- HRMY's Altman-Z score of 5.27 is amongst the best of the industry. HRMY outperforms 81.52% of its industry peers.
- The Debt to FCF ratio of HRMY is 0.83, which is an excellent value as it means it would take HRMY, only 0.83 years of fcf income to pay off all of its debts.
- With an excellent Debt to FCF ratio value of 0.83, HRMY belongs to the best of the industry, outperforming 95.65% of the companies in the same industry.
- A Debt/Equity ratio of 0.28 indicates that HRMY is not too dependend on debt financing.
- A Current Ratio of 3.24 indicates that HRMY has no problem at all paying its short term obligations.
- A Quick Ratio of 3.20 indicates that HRMY has no problem at all paying its short term obligations.
Evaluating Growth: NASDAQ:HRMY
Every stock receives a Growth Rating from ChartMill, ranging from 0 to 10. This rating assesses various growth aspects, including historical and projected EPS and revenue growth. NASDAQ:HRMY boasts a 4 out of 10:
- Measured over the past years, HRMY shows a very strong growth in Earnings Per Share. The EPS has been growing by 44.61% on average per year.
- Based on estimates for the next years, HRMY will show a quite strong growth in Earnings Per Share. The EPS will grow by 10.26% on average per year.
- Based on estimates for the next years, HRMY will show a quite strong growth in Revenue. The Revenue will grow by 19.91% on average per year.
Every day, new Decent Value stocks can be found on ChartMill in our Decent Value screener.
For an up to date full fundamental analysis you can check the fundamental report of HRMY
Disclaimer
This article should in no way be interpreted as advice. The article is based on the observed metrics at the time of writing, but you should always make your own analysis and trade or invest at your own responsibility.
29.61
+0.18 (+0.61%)
Find more stocks in the Stock Screener
HRMY Latest News and Analysis
 3 days ago - ChartmillHARMONY BIOSCIENCES HOLDINGS (NASDAQ:HRMY) is not too expensive for the growth it is showing.
Discover HARMONY BIOSCIENCES HOLDINGS, an undervalued growth gem. NASDAQ:HRMY is shining in terms of growth metrics, and it's also displaying strong financial health and profitability, retaining an appealing valuation.
