HALOZYME THERAPEUTICS INC (NASDAQ:HALO) is showing good growth, while it is not too expensive.
By Mill Chart
Last update: Apr 4, 2025
Here's HALOZYME THERAPEUTICS INC (NASDAQ:HALO) for you, a growth stock our stock screener believes is undervalued. HALO is scoring impressively in terms of growth while demonstrating strong financials. On top of that, it remains attractively priced. Let's break it down further.
Evaluating Growth: HALO
ChartMill assigns a Growth Rating to every stock. This score ranges from 0 to 10 and evaluates the different growth aspects like EPS and Revenue, both in the past as in the future. HALO scores a 8 out of 10:
- HALO shows a strong growth in Earnings Per Share. In the last year, the EPS has been growing by 52.16%, which is quite impressive.
- HALO shows a strong growth in Earnings Per Share. Measured over the last years, the EPS has been growing by 30.12% yearly.
- The Revenue has grown by 22.46% in the past year. This is a very strong growth!
- HALO shows a strong growth in Revenue. Measured over the last years, the Revenue has been growing by 38.95% yearly.
- HALO is expected to show quite a strong growth in Earnings Per Share. In the coming years, the EPS will grow by 15.65% yearly.
- Based on estimates for the next years, HALO will show a quite strong growth in Revenue. The Revenue will grow by 11.45% on average per year.
How We Gauge Valuation for HALO
ChartMill employs its own Valuation Rating system for all stocks. This score, ranging from 0 to 10, is determined by evaluating different valuation factors, including price to earnings and free cash flow, both in absolute terms and relative to the market and industry. HALO has earned a 8 for valuation:
- 97.16% of the companies in the same industry are more expensive than HALO, based on the Price/Earnings ratio.
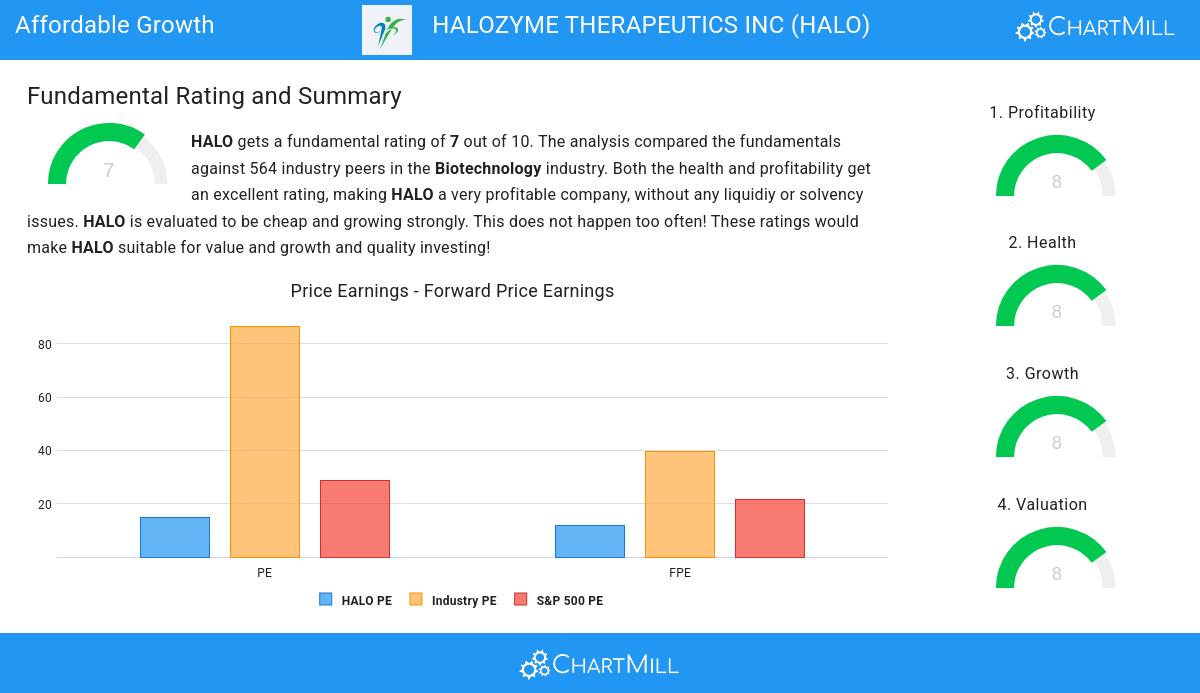
- When comparing the Price/Earnings ratio of HALO to the average of the S&P500 Index (28.67), we can say HALO is valued slightly cheaper.
- The Price/Forward Earnings ratio is 11.80, which indicates a very decent valuation of HALO.
- 96.81% of the companies in the same industry are more expensive than HALO, based on the Price/Forward Earnings ratio.
- The average S&P500 Price/Forward Earnings ratio is at 21.59. HALO is valued slightly cheaper when compared to this.
- Based on the Enterprise Value to EBITDA ratio, HALO is valued cheaper than 96.10% of the companies in the same industry.
- Compared to the rest of the industry, the Price/Free Cash Flow ratio of HALO indicates a rather cheap valuation: HALO is cheaper than 96.28% of the companies listed in the same industry.
- The low PEG Ratio(NY), which compensates the Price/Earnings for growth, indicates a rather cheap valuation of the company.
- HALO has an outstanding profitability rating, which may justify a higher PE ratio.
- HALO's earnings are expected to grow with 24.24% in the coming years. This may justify a more expensive valuation.
Understanding HALO's Health
ChartMill assigns a Health Rating to every stock. This score ranges from 0 to 10 and evaluates the different health aspects like liquidity and solvency, both absolutely, but also relative to the industry peers. HALO scores a 8 out of 10:
- HALO has an Altman-Z score of 4.86. This indicates that HALO is financially healthy and has little risk of bankruptcy at the moment.
- HALO's Altman-Z score of 4.86 is amongst the best of the industry. HALO outperforms 81.74% of its industry peers.
- HALO has a debt to FCF ratio of 3.21. This is a good value and a sign of high solvency as HALO would need 3.21 years to pay back of all of its debts.
- Looking at the Debt to FCF ratio, with a value of 3.21, HALO belongs to the top of the industry, outperforming 93.79% of the companies in the same industry.
- HALO has a Current Ratio of 7.80. This indicates that HALO is financially healthy and has no problem in meeting its short term obligations.
- HALO has a better Current ratio (7.80) than 73.40% of its industry peers.
- A Quick Ratio of 6.78 indicates that HALO has no problem at all paying its short term obligations.
- HALO has a Quick ratio of 6.78. This is in the better half of the industry: HALO outperforms 67.91% of its industry peers.
How do we evaluate the Profitability for HALO?
ChartMill's Profitability Rating offers a unique perspective on stock analysis, providing scores from 0 to 10. These ratings consider a wide range of profitability metrics and margins, both in comparison to industry peers and on their own merits. For HALO, the assigned 8 is a significant indicator of profitability:
- Looking at the Return On Assets, with a value of 21.52%, HALO belongs to the top of the industry, outperforming 98.94% of the companies in the same industry.
- The Return On Equity of HALO (122.06%) is better than 99.47% of its industry peers.
- Looking at the Return On Invested Capital, with a value of 23.00%, HALO belongs to the top of the industry, outperforming 98.94% of the companies in the same industry.
- Measured over the past 3 years, the Average Return On Invested Capital for HALO is above the industry average of 14.31%.
- The 3 year average ROIC (17.81%) for HALO is below the current ROIC(23.00%), indicating increased profibility in the last year.
- Looking at the Profit Margin, with a value of 43.74%, HALO belongs to the top of the industry, outperforming 99.11% of the companies in the same industry.
- HALO has a Operating Margin of 54.32%. This is amongst the best in the industry. HALO outperforms 99.82% of its industry peers.
- The Gross Margin of HALO (84.30%) is better than 87.06% of its industry peers.
- HALO's Gross Margin has improved in the last couple of years.
More Affordable Growth stocks can be found in our Affordable Growth screener.
For an up to date full fundamental analysis you can check the fundamental report of HALO
Disclaimer
This is not investing advice! The article highlights some of the observations at the time of writing, but you should always make your own analysis and invest based on your own insights.
58.41
+0.2 (+0.34%)
Find more stocks in the Stock Screener
HALO Latest News and Analysis
 6 days ago - ChartmillHALOZYME THERAPEUTICS INC (NASDAQ:HALO), a strong growth stock, setting up for a breakout.
Based on a technical and fundamental analysis of NASDAQ:HALO we conclude: HALOZYME THERAPEUTICS INC (NASDAQ:HALO)—A High-Growth Stock Gearing Up for Its Next Upward Move.
 14 days ago - ChartmillInvestors should take notice of HALOZYME THERAPEUTICS INC (NASDAQ:HALO)—it offers a great deal for the fundamentals it presents.
HALOZYME THERAPEUTICS INC is a hidden gem, featuring undervaluation and robust fundamentals. NASDAQ:HALO showcases decent financial health and profitability, coupled with an attractive price.
 20 days ago - ChartmillHALOZYME THERAPEUTICS INC (NASDAQ:HALO) is showing good growth, while it is not too expensive.
Uncover the potential of HALOZYME THERAPEUTICS INC, a growth stock reasonably priced. NASDAQ:HALO is excelling in growth aspects, maintaining a healthy financial position, and still offers an attractive valuation.
