In the world of growth stocks, NASDAQ:HALO shines as a value proposition.
By Mill Chart
Last update: Jan 27, 2025
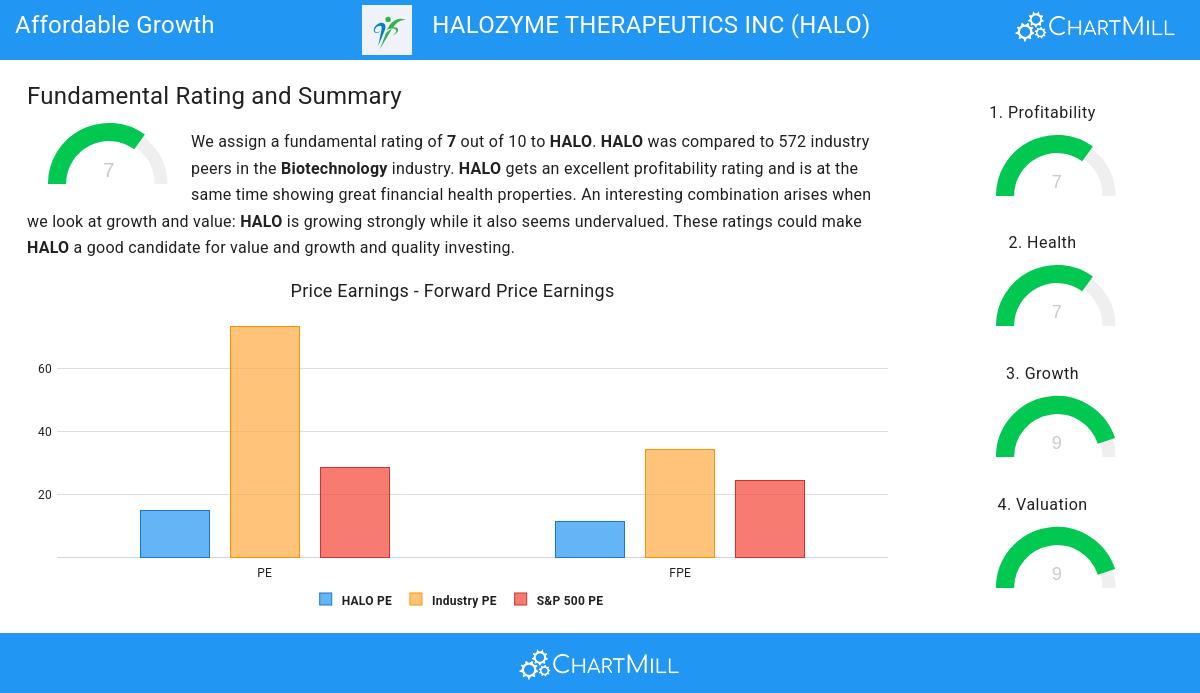
Our stock screener has singled out HALOZYME THERAPEUTICS INC (NASDAQ:HALO) as an attractive growth opportunity. NASDAQ:HALO is demonstrating remarkable growth potential while maintaining strong financial indicators, making it a reasonably priced option. We'll explore this further.
ChartMill's Evaluation of Growth
To evaluate a stock's growth potential, ChartMill utilizes a Growth Rating on a scale of 0 to 10. This comprehensive assessment considers various growth aspects, including historical and estimated EPS and revenue growth. NASDAQ:HALO has achieved a 9 out of 10:
- The Earnings Per Share has grown by an impressive 55.33% over the past year.
- The Earnings Per Share has been growing by 45.64% on average over the past years. This is a very strong growth
- Looking at the last year, HALO shows a very strong growth in Revenue. The Revenue has grown by 21.36%.
- Measured over the past years, HALO shows a very strong growth in Revenue. The Revenue has been growing by 40.42% on average per year.
- The Earnings Per Share is expected to grow by 25.94% on average over the next years. This is a very strong growth
- Based on estimates for the next years, HALO will show a quite strong growth in Revenue. The Revenue will grow by 16.59% on average per year.
What does the Valuation looks like for NASDAQ:HALO
ChartMill assigns a Valuation Rating to every stock. This score ranges from 0 to 10 and evaluates the different valuation aspects and compares the price to earnings and cash flows, while taking into account profitability and growth. NASDAQ:HALO scores a 9 out of 10:
- Based on the Price/Earnings ratio, HALO is valued cheaply inside the industry as 96.99% of the companies are valued more expensively.
- Compared to an average S&P500 Price/Earnings ratio of 28.58, HALO is valued a bit cheaper.
- The Price/Forward Earnings ratio is 11.20, which indicates a very decent valuation of HALO.
- HALO's Price/Forward Earnings ratio is rather cheap when compared to the industry. HALO is cheaper than 97.70% of the companies in the same industry.
- HALO's Price/Forward Earnings ratio indicates a rather cheap valuation when compared to the S&P500 average which is at 24.47.
- Compared to the rest of the industry, the Enterprise Value to EBITDA ratio of HALO indicates a rather cheap valuation: HALO is cheaper than 96.64% of the companies listed in the same industry.
- Compared to the rest of the industry, the Price/Free Cash Flow ratio of HALO indicates a rather cheap valuation: HALO is cheaper than 96.99% of the companies listed in the same industry.
- HALO's low PEG Ratio(NY), which compensates the Price/Earnings for growth, indicates a rather cheap valuation of the company.
- The decent profitability rating of HALO may justify a higher PE ratio.
- HALO's earnings are expected to grow with 32.40% in the coming years. This may justify a more expensive valuation.
A Closer Look at Health for NASDAQ:HALO
ChartMill utilizes a Health Rating to assess stocks, scoring them on a scale of 0 to 10. This rating takes into account a variety of liquidity and solvency ratios, both in absolute terms and in comparison to industry peers. NASDAQ:HALO has earned a 7 out of 10:
- An Altman-Z score of 4.59 indicates that HALO is not in any danger for bankruptcy at the moment.
- With a decent Altman-Z score value of 4.59, HALO is doing good in the industry, outperforming 79.65% of the companies in the same industry.
- HALO has a debt to FCF ratio of 3.83. This is a good value and a sign of high solvency as HALO would need 3.83 years to pay back of all of its debts.
- HALO's Debt to FCF ratio of 3.83 is amongst the best of the industry. HALO outperforms 94.16% of its industry peers.
- A Current Ratio of 10.36 indicates that HALO has no problem at all paying its short term obligations.
- HALO's Current ratio of 10.36 is amongst the best of the industry. HALO outperforms 81.59% of its industry peers.
- A Quick Ratio of 9.15 indicates that HALO has no problem at all paying its short term obligations.
- The Quick ratio of HALO (9.15) is better than 77.35% of its industry peers.
Looking at the Profitability
ChartMill employs its own Profitability Rating system for stock evaluation. This score, ranging from 0 to 10, is derived from an analysis of diverse profitability metrics and margins. In the case of NASDAQ:HALO, the assigned 7 is noteworthy for profitability:
- With an excellent Return On Assets value of 18.53%, HALO belongs to the best of the industry, outperforming 98.58% of the companies in the same industry.
- HALO's Return On Equity of 86.69% is amongst the best of the industry. HALO outperforms 99.65% of its industry peers.
- HALO has a Return On Invested Capital of 19.23%. This is amongst the best in the industry. HALO outperforms 98.05% of its industry peers.
- Measured over the past 3 years, the Average Return On Invested Capital for HALO is above the industry average of 13.83%.
- The 3 year average ROIC (17.78%) for HALO is below the current ROIC(19.23%), indicating increased profibility in the last year.
- HALO has a Profit Margin of 41.43%. This is amongst the best in the industry. HALO outperforms 98.76% of its industry peers.
- HALO has a better Operating Margin (50.35%) than 100.00% of its industry peers.
- With an excellent Gross Margin value of 82.09%, HALO belongs to the best of the industry, outperforming 87.26% of the companies in the same industry.
Our Affordable Growth screener lists more Affordable Growth stocks and is updated daily.
For an up to date full fundamental analysis you can check the fundamental report of HALO
Keep in mind
This article should in no way be interpreted as advice. The article is based on the observed metrics at the time of writing, but you should always make your own analysis and trade or invest at your own responsibility.
58.79
-0.03 (-0.05%)
Find more stocks in the Stock Screener
HALO Latest News and Analysis
 12 hours ago - ChartmillHALOZYME THERAPEUTICS INC (NASDAQ:HALO), a strong growth stock, setting up for a breakout.
Based on a technical and fundamental analysis of NASDAQ:HALO we conclude: HALOZYME THERAPEUTICS INC (NASDAQ:HALO)—A High-Growth Stock Gearing Up for Its Next Upward Move.
 9 days ago - ChartmillInvestors should take notice of HALOZYME THERAPEUTICS INC (NASDAQ:HALO)—it offers a great deal for the fundamentals it presents.
HALOZYME THERAPEUTICS INC is a hidden gem, featuring undervaluation and robust fundamentals. NASDAQ:HALO showcases decent financial health and profitability, coupled with an attractive price.
 14 days ago - ChartmillHALOZYME THERAPEUTICS INC (NASDAQ:HALO) is showing good growth, while it is not too expensive.
Uncover the potential of HALOZYME THERAPEUTICS INC, a growth stock reasonably priced. NASDAQ:HALO is excelling in growth aspects, maintaining a healthy financial position, and still offers an attractive valuation.
 18 days ago - ChartmillIs HALOZYME THERAPEUTICS INC (NASDAQ:HALO) a Minervini-style stock?
Why HALOZYME THERAPEUTICS INC (NASDAQ:HALO) qualifies as a high growth stock. A fundamental and technical analysis of (NASDAQ:HALO).
