HAEMONETICS CORP/MASS (NYSE:HAE) is an undervalued gem with solid fundamentals.
By Mill Chart
Last update: Apr 17, 2025
Uncover the hidden value in HAEMONETICS CORP/MASS (NYSE:HAE) as our stock screening tool recommends it as an undervalued choice. HAE maintains a robust financial position and offers an attractive pricing perspective. Let's dig deeper into the analysis.
Deciphering HAE's Valuation Rating
ChartMill assigns a proprietary Valuation Rating to each stock. The score is computed by evaluating various valuation aspects, like price to earnings and free cash flow, both absolutely as relative to the market and industry. HAE was assigned a score of 8 for valuation:
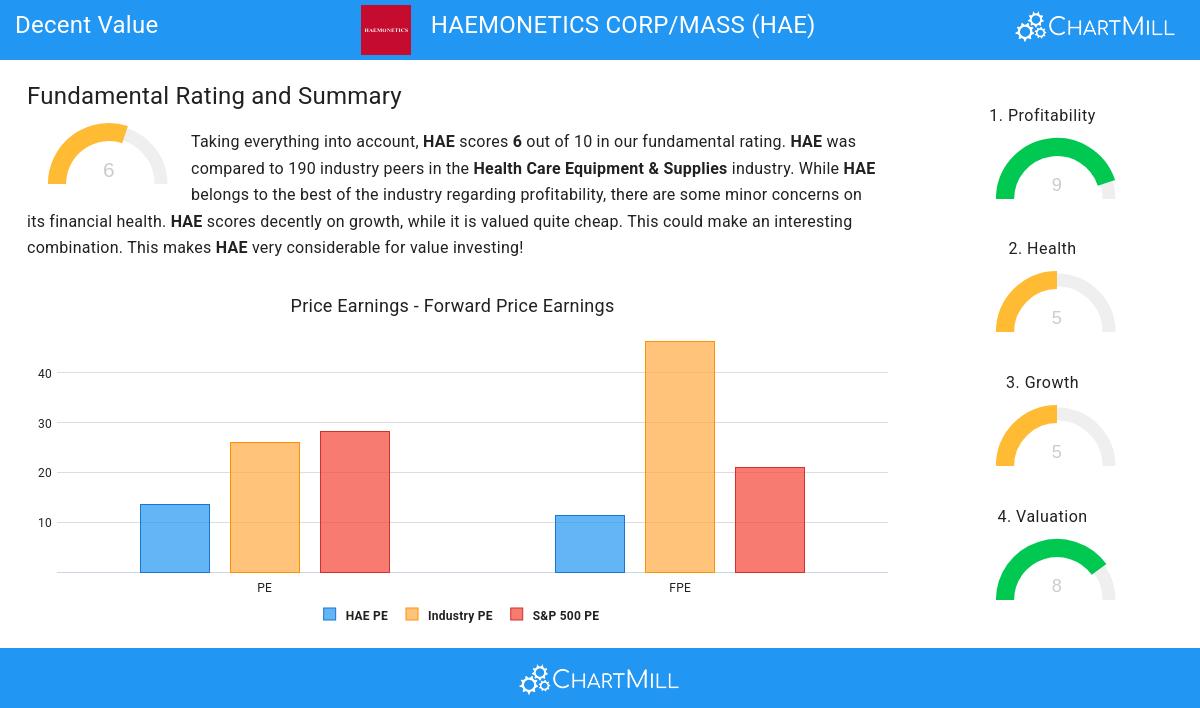
- Based on the Price/Earnings ratio, HAE is valued cheaper than 88.95% of the companies in the same industry.
- Compared to an average S&P500 Price/Earnings ratio of 28.13, HAE is valued rather cheaply.
- The Price/Forward Earnings ratio is 11.34, which indicates a very decent valuation of HAE.
- 91.58% of the companies in the same industry are more expensive than HAE, based on the Price/Forward Earnings ratio.
- Compared to an average S&P500 Price/Forward Earnings ratio of 21.03, HAE is valued a bit cheaper.
- 86.84% of the companies in the same industry are more expensive than HAE, based on the Enterprise Value to EBITDA ratio.
- HAE's Price/Free Cash Flow ratio is a bit cheaper when compared to the industry. HAE is cheaper than 78.42% of the companies in the same industry.
- The low PEG Ratio(NY), which compensates the Price/Earnings for growth, indicates a rather cheap valuation of the company.
- The excellent profitability rating of HAE may justify a higher PE ratio.
- HAE's earnings are expected to grow with 13.16% in the coming years. This may justify a more expensive valuation.
What does the Profitability looks like for HAE
ChartMill assigns a Profitability Rating to every stock. This score ranges from 0 to 10 and evaluates the different profitability ratios and margins, both absolutely, but also relative to the industry peers. HAE scores a 9 out of 10:
- HAE has a Return On Assets of 5.14%. This is amongst the best in the industry. HAE outperforms 85.26% of its industry peers.
- The Return On Equity of HAE (14.34%) is better than 90.00% of its industry peers.
- HAE has a better Return On Invested Capital (7.64%) than 84.74% of its industry peers.
- The 3 year average ROIC (7.51%) for HAE is below the current ROIC(7.64%), indicating increased profibility in the last year.
- HAE has a better Profit Margin (9.47%) than 83.68% of its industry peers.
- In the last couple of years the Profit Margin of HAE has grown nicely.
- HAE has a better Operating Margin (15.93%) than 86.32% of its industry peers.
- In the last couple of years the Operating Margin of HAE has grown nicely.
- In the last couple of years the Gross Margin of HAE has grown nicely.
Looking at the Health
ChartMill employs its own Health Rating for stock assessment. This rating, ranging from 0 to 10, is calculated by examining various liquidity and solvency ratios. In the case of HAE, the assigned 5 reflects its health status:
- HAE's Altman-Z score of 2.46 is fine compared to the rest of the industry. HAE outperforms 66.84% of its industry peers.
- HAE has a better Debt to FCF ratio (14.71) than 72.11% of its industry peers.
- A Current Ratio of 3.97 indicates that HAE has no problem at all paying its short term obligations.
- Looking at the Current ratio, with a value of 3.97, HAE is in the better half of the industry, outperforming 66.84% of the companies in the same industry.
- HAE has a Quick Ratio of 2.55. This indicates that HAE is financially healthy and has no problem in meeting its short term obligations.
- HAE has a Quick ratio of 2.55. This is in the better half of the industry: HAE outperforms 61.58% of its industry peers.
Understanding HAE's Growth
A key component of ChartMill's stock assessment is the Growth Rating, which spans from 0 to 10. This rating evaluates diverse growth factors, such as EPS and revenue growth, considering both past performance and future projections. HAE has received a 5 out of 10:
- The Earnings Per Share has grown by an nice 9.87% over the past year.
- Measured over the past years, HAE shows a quite strong growth in Earnings Per Share. The EPS has been growing by 10.74% on average per year.
- Looking at the last year, HAE shows a quite strong growth in Revenue. The Revenue has grown by 8.14% in the last year.
- Based on estimates for the next years, HAE will show a quite strong growth in Earnings Per Share. The EPS will grow by 15.45% on average per year.
- When comparing the EPS growth rate of the last years to the growth rate of the upcoming years, we see that the growth is accelerating.
More Decent Value stocks can be found in our Decent Value screener.
Check the latest full fundamental report of HAE for a complete fundamental analysis.
Disclaimer
This is not investing advice! The article highlights some of the observations at the time of writing, but you should always make your own analysis and invest based on your own insights.
57
-0.17 (-0.3%)
Find more stocks in the Stock Screener
HAE Latest News and Analysis
 5 days ago - ChartmillHAEMONETICS CORP/MASS (NYSE:HAE) is an undervalued gem with solid fundamentals.
HAEMONETICS CORP/MASS has caught the attention as a great value stock. NYSE:HAE excels in profitability, solvency, and liquidity, all while being very reasonably priced.
