
A technical analysis of GRAPHIC PACKAGING HOLDING CO.
By Mill Chart
Last update: Oct 3, 2024
GRAPHIC PACKAGING HOLDING CO (NYSE:GPK) was identified as a Technical Breakout Setup Pattern by our stockscreener. Such a pattern occurs when we see a pause in a strong uptrend: after a strong rise the stock is consolidating a bit and at some point the trend may be continued. Whether this actually happens can not be predicted of course, but it may be a good idea to keep and eye on NYSE:GPK.
Technical Analysis Observations
At ChartMill, a crucial aspect of their analysis is the assignment of a Technical Rating to each stock. This rating, ranging from 0 to 10, is calculated daily by considering numerous technical indicators and properties.
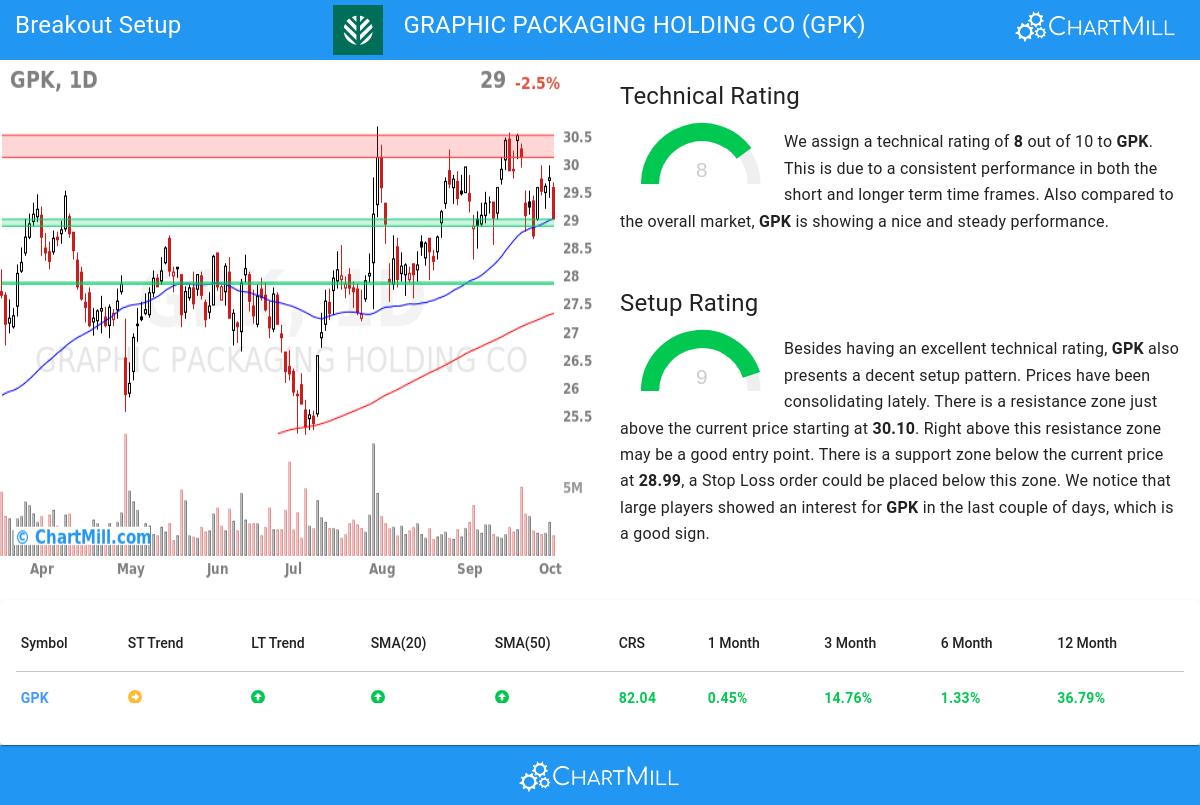
Taking everything into account, GPK scores 8 out of 10 in our technical rating. This is due to a consistent performance in both the short and longer term time frames. Also compared to the overall market, GPK is showing a nice and steady performance.
- The short term is neutral, but the long term trend is still positive. Not much to worry about for now.
- When comparing the yearly performance of all stocks, we notice that GPK is one of the better performing stocks in the market, outperforming 82% of all stocks.
- GPK is part of the Containers & Packaging industry. There are 24 other stocks in this industry. GPK outperforms 82% of them.
- GPK is currently trading in the upper part of its 52 week range. The S&P500 Index however is currently trading near a new high, so GPK is lagging the market slightly.
- In the last month GPK has a been trading in the 28.47 - 30.55 range, which is quite wide. It is currently trading in the middle of this range, so some resistance may be found above.
Check the latest full technical report of GPK for a complete technical analysis.
Looking at the Setup
ChartMill takes into account not only the Technical Rating but also assigns a Setup Rating to each stock. This rating, on a scale of 0 to 10, reflects the degree of consolidation observed based on short-term technical indicators. Currently, NYSE:GPK exhibits a 9 setup rating, indicating its consolidation status in recent days and weeks.
GPK has an excellent technical rating and also presents a decent setup pattern. Prices have been consolidating lately. There is a resistance zone just above the current price starting at 30.10. Right above this resistance zone may be a good entry point. There is a support zone below the current price at 28.99, a Stop Loss order could be placed below this zone. We notice that large players showed an interest for GPK in the last couple of days, which is a good sign.
How can NYSE:GPK be traded?
For a potential trade one would typically wait until the stock breaks out of the consolidation zone to enter the stock and it could be sold again for a loss when it would fall back below the zone.
Disclaimer: This article is not intended to provide trading advice. It is crucial to conduct your own analysis and consider your own observations and trading style when making investment decisions. The article solely presents technical observations and should not be relied upon as a sole basis for trading.
Our Breakout screener lists more breakout setups and is updated daily.
Keep in mind
This article should in no way be interpreted as advice. The article is based on the observed metrics at the time of writing, but you should always make your own analysis and trade or invest at your own responsibility.