
Don't overlook ALPHABET INC-CL A (NASDAQ:GOOGL)—a stock with solid growth prospects and a reasonable valuation.
By Mill Chart
Last update: Mar 28, 2025
Our stock screening tool has pinpointed ALPHABET INC-CL A (NASDAQ:GOOGL) as a growth stock that isn't overvalued. GOOGL is excelling in various growth indicators while maintaining a solid financial footing. Furthermore, it remains attractively priced. Let's delve into the specifics below.
How do we evaluate the Growth for GOOGL?
ChartMill assigns a Growth Rating to every stock. This score ranges from 0 to 10 and evaluates the different growth aspects like EPS and Revenue, both in the past as in the future. GOOGL scores a 7 out of 10:
- GOOGL shows a strong growth in Earnings Per Share. In the last year, the EPS has been growing by 38.79%, which is quite impressive.
- GOOGL shows a strong growth in Earnings Per Share. Measured over the last years, the EPS has been growing by 25.25% yearly.
- GOOGL shows quite a strong growth in Revenue. In the last year, the Revenue has grown by 13.87%.
- GOOGL shows quite a strong growth in Revenue. Measured over the last years, the Revenue has been growing by 16.68% yearly.
- GOOGL is expected to show quite a strong growth in Earnings Per Share. In the coming years, the EPS will grow by 15.30% yearly.
- The Revenue is expected to grow by 10.97% on average over the next years. This is quite good.
Evaluating Valuation: GOOGL
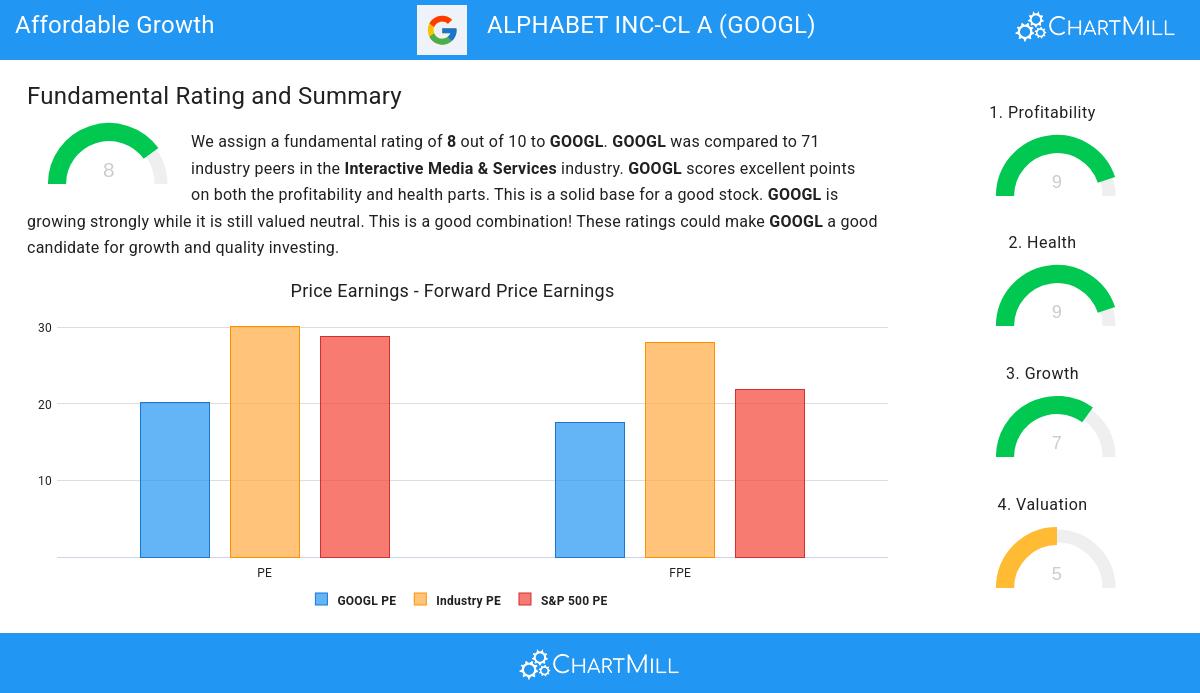
ChartMill employs its own Valuation Rating system for all stocks. This score, ranging from 0 to 10, is determined by evaluating different valuation factors, including price to earnings and free cash flow, both in absolute terms and relative to the market and industry. GOOGL has earned a 5 for valuation:
- 71.83% of the companies in the same industry are more expensive than GOOGL, based on the Price/Earnings ratio.
- The average S&P500 Price/Earnings ratio is at 28.81. GOOGL is valued slightly cheaper when compared to this.
- 66.20% of the companies in the same industry are more expensive than GOOGL, based on the Price/Forward Earnings ratio.
- Based on the Enterprise Value to EBITDA ratio, GOOGL is valued a bit cheaper than the industry average as 77.46% of the companies are valued more expensively.
- Compared to the rest of the industry, the Price/Free Cash Flow ratio of GOOGL indicates a somewhat cheap valuation: GOOGL is cheaper than 67.61% of the companies listed in the same industry.
- GOOGL has an outstanding profitability rating, which may justify a higher PE ratio.
- GOOGL's earnings are expected to grow with 14.36% in the coming years. This may justify a more expensive valuation.
Health Examination for GOOGL
ChartMill assigns a Health Rating to every stock. This score ranges from 0 to 10 and evaluates the different health aspects like liquidity and solvency, both absolutely, but also relative to the industry peers. GOOGL scores a 9 out of 10:
- GOOGL has an Altman-Z score of 12.07. This indicates that GOOGL is financially healthy and has little risk of bankruptcy at the moment.
- GOOGL has a better Altman-Z score (12.07) than 91.55% of its industry peers.
- The Debt to FCF ratio of GOOGL is 0.17, which is an excellent value as it means it would take GOOGL, only 0.17 years of fcf income to pay off all of its debts.
- GOOGL has a Debt to FCF ratio of 0.17. This is amongst the best in the industry. GOOGL outperforms 81.69% of its industry peers.
- GOOGL has a Debt/Equity ratio of 0.03. This is a healthy value indicating a solid balance between debt and equity.
- The Debt to Equity ratio of GOOGL (0.03) is better than 60.56% of its industry peers.
- The current and quick ratio evaluation for GOOGL is rather negative, while it does have excellent solvency and profitability. These ratios do not necessarly indicate liquidity issues and need to be evaluated against the specifics of the business.
Evaluating Profitability: GOOGL
ChartMill utilizes a Profitability Rating to assess stocks, scoring them on a scale of 0 to 10. This rating takes into account a variety of profitability ratios and margins, both in absolute terms and in comparison to industry peers. GOOGL has earned a 9 out of 10:
- GOOGL has a Return On Assets of 22.24%. This is amongst the best in the industry. GOOGL outperforms 95.77% of its industry peers.
- The Return On Equity of GOOGL (30.80%) is better than 95.77% of its industry peers.
- GOOGL's Return On Invested Capital of 27.32% is amongst the best of the industry. GOOGL outperforms 98.59% of its industry peers.
- GOOGL had an Average Return On Invested Capital over the past 3 years of 24.15%. This is significantly above the industry average of 11.32%.
- The last Return On Invested Capital (27.32%) for GOOGL is above the 3 year average (24.15%), which is a sign of increasing profitability.
- GOOGL's Profit Margin of 28.60% is amongst the best of the industry. GOOGL outperforms 94.37% of its industry peers.
- GOOGL's Profit Margin has improved in the last couple of years.
- GOOGL's Operating Margin of 32.79% is amongst the best of the industry. GOOGL outperforms 98.59% of its industry peers.
- GOOGL's Operating Margin has improved in the last couple of years.
Every day, new Affordable Growth stocks can be found on ChartMill in our Affordable Growth screener.
For an up to date full fundamental analysis you can check the fundamental report of GOOGL
Disclaimer
This is not investing advice! The article highlights some of the observations at the time of writing, but you should always make your own analysis and invest based on your own insights.
309.29
-3.14 (-1.01%)
Find more stocks in the Stock Screener
GOOGL Latest News and Analysis


