
ALPHABET INC-CL A (NASDAQ:GOOGL) was identified as an affordable growth stock by our stock screener. NASDAQ:GOOGL is showing great growth, but also scores well on profitability, solvency and liquidity. At the same time it seems to be priced reasonably. We'll explore this a bit deeper below.
Analyzing Growth Metrics
Every stock receives a Growth Rating from ChartMill, ranging from 0 to 10. This rating assesses various growth aspects, including historical and projected EPS and revenue growth. NASDAQ:GOOGL boasts a 7 out of 10:
- GOOGL shows a strong growth in Earnings Per Share. In the last year, the EPS has been growing by 47.67%, which is quite impressive.
- Measured over the past years, GOOGL shows a quite strong growth in Earnings Per Share. The EPS has been growing by 19.55% on average per year.
- GOOGL shows quite a strong growth in Revenue. In the last year, the Revenue has grown by 13.38%.
- GOOGL shows quite a strong growth in Revenue. Measured over the last years, the Revenue has been growing by 17.57% yearly.
- GOOGL is expected to show quite a strong growth in Earnings Per Share. In the coming years, the EPS will grow by 19.96% yearly.
- GOOGL is expected to show quite a strong growth in Revenue. In the coming years, the Revenue will grow by 10.62% yearly.
What does the Valuation looks like for NASDAQ:GOOGL
ChartMill employs its own Valuation Rating system for all stocks. This score, ranging from 0 to 10, is determined by evaluating different valuation factors, including price to earnings and free cash flow, both in absolute terms and relative to the market and industry. NASDAQ:GOOGL has earned a 6 for valuation:
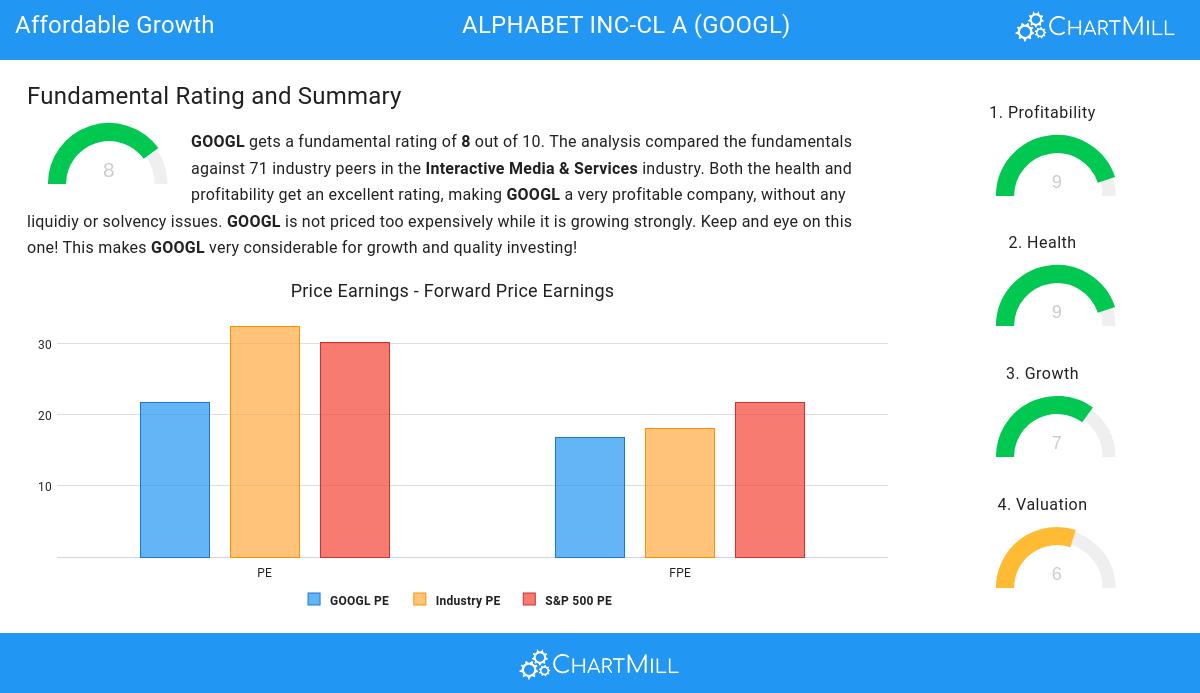
- GOOGL's Price/Earnings ratio is a bit cheaper when compared to the industry. GOOGL is cheaper than 69.57% of the companies in the same industry.
- Compared to an average S&P500 Price/Earnings ratio of 30.15, GOOGL is valued a bit cheaper.
- 65.22% of the companies in the same industry are more expensive than GOOGL, based on the Price/Forward Earnings ratio.
- Compared to an average S&P500 Price/Forward Earnings ratio of 21.77, GOOGL is valued a bit cheaper.
- Compared to the rest of the industry, the Enterprise Value to EBITDA ratio of GOOGL indicates a somewhat cheap valuation: GOOGL is cheaper than 68.12% of the companies listed in the same industry.
- GOOGL's Price/Free Cash Flow ratio is a bit cheaper when compared to the industry. GOOGL is cheaper than 65.22% of the companies in the same industry.
- GOOGL's low PEG Ratio(NY), which compensates the Price/Earnings for growth, indicates a rather cheap valuation of the company.
- The excellent profitability rating of GOOGL may justify a higher PE ratio.
- GOOGL's earnings are expected to grow with 21.32% in the coming years. This may justify a more expensive valuation.
Health Analysis for NASDAQ:GOOGL
ChartMill employs a unique Health Rating system for all stocks. This rating, ranging from 0 to 10, is determined by analyzing various liquidity and solvency ratios. For NASDAQ:GOOGL, the assigned 9 for health provides valuable insights:
- An Altman-Z score of 12.39 indicates that GOOGL is not in any danger for bankruptcy at the moment.
- With an excellent Altman-Z score value of 12.39, GOOGL belongs to the best of the industry, outperforming 91.30% of the companies in the same industry.
- The Debt to FCF ratio of GOOGL is 0.23, which is an excellent value as it means it would take GOOGL, only 0.23 years of fcf income to pay off all of its debts.
- GOOGL has a Debt to FCF ratio of 0.23. This is amongst the best in the industry. GOOGL outperforms 84.06% of its industry peers.
- A Debt/Equity ratio of 0.04 indicates that GOOGL is not too dependend on debt financing.
- GOOGL has a Current Ratio of 2.08. This indicates that GOOGL is financially healthy and has no problem in meeting its short term obligations.
- A Quick Ratio of 2.08 indicates that GOOGL has no problem at all paying its short term obligations.
Looking at the Profitability
ChartMill employs its own Profitability Rating system for stock evaluation. This score, ranging from 0 to 10, is derived from an analysis of diverse profitability metrics and margins. In the case of NASDAQ:GOOGL, the assigned 9 is noteworthy for profitability:
- GOOGL has a better Return On Assets (21.13%) than 97.10% of its industry peers.
- The Return On Equity of GOOGL (29.15%) is better than 95.65% of its industry peers.
- The Return On Invested Capital of GOOGL (25.85%) is better than 98.55% of its industry peers.
- GOOGL had an Average Return On Invested Capital over the past 3 years of 22.84%. This is significantly above the industry average of 10.42%.
- The last Return On Invested Capital (25.85%) for GOOGL is above the 3 year average (22.84%), which is a sign of increasing profitability.
- With an excellent Profit Margin value of 26.70%, GOOGL belongs to the best of the industry, outperforming 95.65% of the companies in the same industry.
- GOOGL has a Operating Margin of 30.77%. This is amongst the best in the industry. GOOGL outperforms 98.55% of its industry peers.
- GOOGL's Operating Margin has improved in the last couple of years.
Every day, new Affordable Growth stocks can be found on ChartMill in our Affordable Growth screener.
For an up to date full fundamental analysis you can check the fundamental report of GOOGL
Disclaimer
This article should in no way be interpreted as advice. The article is based on the observed metrics at the time of writing, but you should always make your own analysis and trade or invest at your own responsibility.


