Despite its growth, ALPHABET INC-CL C (NASDAQ:GOOG) remains within the realm of affordability.
By Mill Chart
Last update: Mar 7, 2025
Uncover the potential of ALPHABET INC-CL C (NASDAQ:GOOG), a growth stock that our stock screener found to be reasonably priced. NASDAQ:GOOG is excelling in growth aspects, maintaining a healthy financial position, and still offers an attractive valuation. We'll examine each aspect in detail.
Growth Analysis for NASDAQ:GOOG
ChartMill employs its own Growth Rating system for all stocks. This score, ranging from 0 to 10, is derived by evaluating different growth factors, such as EPS and revenue growth, taking into account both past performance and future projections. NASDAQ:GOOG has earned a 7 for growth:
- The Earnings Per Share has grown by an impressive 38.79% over the past year.
- Measured over the past years, GOOG shows a very strong growth in Earnings Per Share. The EPS has been growing by 25.25% on average per year.
- GOOG shows quite a strong growth in Revenue. In the last year, the Revenue has grown by 13.87%.
- GOOG shows quite a strong growth in Revenue. Measured over the last years, the Revenue has been growing by 16.68% yearly.
- The Earnings Per Share is expected to grow by 16.13% on average over the next years. This is quite good.
- Based on estimates for the next years, GOOG will show a quite strong growth in Revenue. The Revenue will grow by 10.86% on average per year.
Exploring NASDAQ:GOOG's Valuation
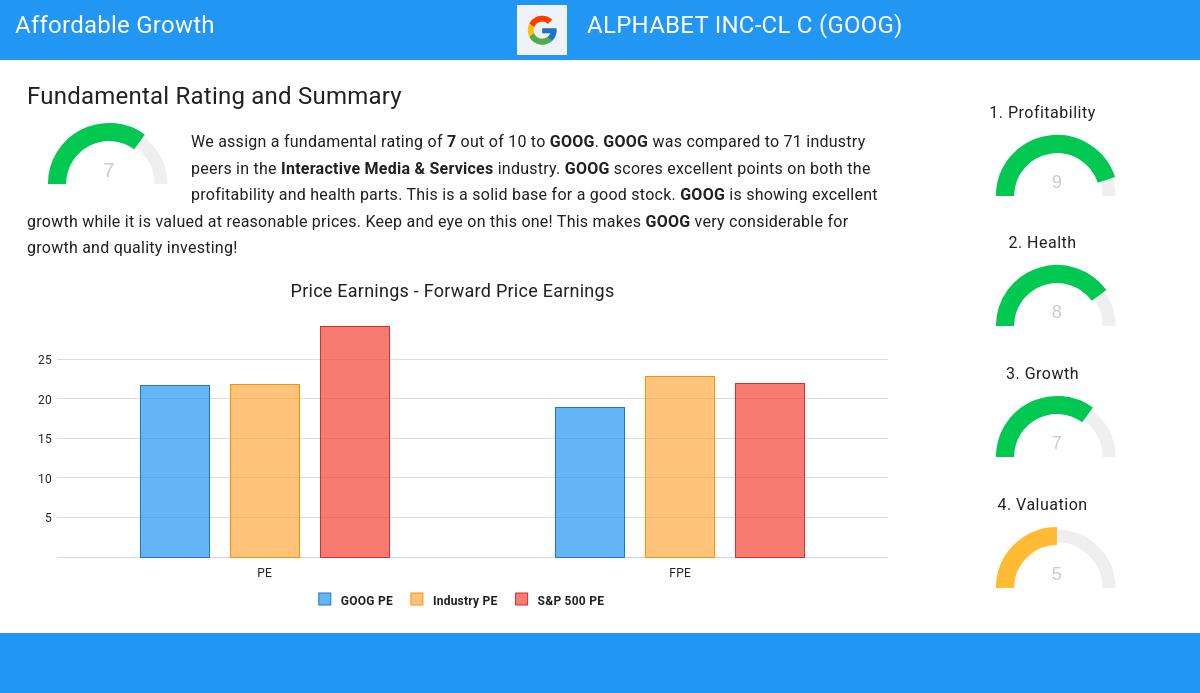
An integral part of ChartMill's stock analysis is the Valuation Rating, which spans from 0 to 10. This rating evaluates diverse valuation factors, including price to earnings and cash flows, while considering the stock's profitability and growth. NASDAQ:GOOG has received a 5 out of 10:
- Compared to the rest of the industry, the Price/Earnings ratio of GOOG indicates a somewhat cheap valuation: GOOG is cheaper than 67.61% of the companies listed in the same industry.
- Compared to an average S&P500 Price/Earnings ratio of 29.16, GOOG is valued a bit cheaper.
- Based on the Price/Forward Earnings ratio, GOOG is valued a bit cheaper than the industry average as 63.38% of the companies are valued more expensively.
- 71.83% of the companies in the same industry are more expensive than GOOG, based on the Enterprise Value to EBITDA ratio.
- Based on the Price/Free Cash Flow ratio, GOOG is valued a bit cheaper than 61.97% of the companies in the same industry.
- The excellent profitability rating of GOOG may justify a higher PE ratio.
- GOOG's earnings are expected to grow with 14.36% in the coming years. This may justify a more expensive valuation.
Understanding NASDAQ:GOOG's Health Score
ChartMill assigns a Health Rating to every stock. This score ranges from 0 to 10 and evaluates the different health aspects like liquidity and solvency, both absolutely, but also relative to the industry peers. NASDAQ:GOOG scores a 8 out of 10:
- GOOG has an Altman-Z score of 12.77. This indicates that GOOG is financially healthy and has little risk of bankruptcy at the moment.
- GOOG has a Altman-Z score of 12.77. This is amongst the best in the industry. GOOG outperforms 92.96% of its industry peers.
- GOOG has a debt to FCF ratio of 0.17. This is a very positive value and a sign of high solvency as it would only need 0.17 years to pay back of all of its debts.
- The Debt to FCF ratio of GOOG (0.17) is better than 78.87% of its industry peers.
- A Debt/Equity ratio of 0.03 indicates that GOOG is not too dependend on debt financing.
- GOOG does not score too well on the current and quick ratio evaluation. However, as it has excellent solvency and profitability, these ratios do not necessarly indicate liquidity issues and need to be evaluated against the specifics of the business.
Profitability Examination for NASDAQ:GOOG
Discover ChartMill's exclusive Profitability Rating, a proprietary metric that assesses stocks on a scale of 0 to 10. It takes into consideration various profitability ratios and margins, both in absolute terms and relative to industry peers. Notably, NASDAQ:GOOG has achieved a 9:
- The Return On Assets of GOOG (22.24%) is better than 94.37% of its industry peers.
- GOOG has a Return On Equity of 30.80%. This is amongst the best in the industry. GOOG outperforms 94.37% of its industry peers.
- With an excellent Return On Invested Capital value of 27.32%, GOOG belongs to the best of the industry, outperforming 97.18% of the companies in the same industry.
- GOOG had an Average Return On Invested Capital over the past 3 years of 24.15%. This is significantly above the industry average of 11.30%.
- The 3 year average ROIC (24.15%) for GOOG is below the current ROIC(27.32%), indicating increased profibility in the last year.
- GOOG's Profit Margin of 28.60% is amongst the best of the industry. GOOG outperforms 92.96% of its industry peers.
- In the last couple of years the Profit Margin of GOOG has grown nicely.
- GOOG has a Operating Margin of 32.79%. This is amongst the best in the industry. GOOG outperforms 97.18% of its industry peers.
- In the last couple of years the Operating Margin of GOOG has grown nicely.
Every day, new Affordable Growth stocks can be found on ChartMill in our Affordable Growth screener.
For an up to date full fundamental analysis you can check the fundamental report of GOOG
Disclaimer
Important Note: The content of this article is not intended as trading advice. It is essential to perform your own analysis and exercise caution when making trading decisions. The article presents observations created by automated analysis but does not guarantee any trading or investment outcomes. Always trade responsibly and make independent judgments.
175.75
+1.54 (+0.88%)
Find more stocks in the Stock Screener
GOOG Latest News and Analysis
 a day ago - ChartmillIs ALPHABET INC-CL C (NASDAQ:GOOG) the type of stock Peter Lynch would love?
Let’s dive into ALPHABET INC-CL C (NASDAQ:GOOG) using Peter Lynch’s key investing principles, from earnings growth and debt levels to long-term scalability and valuation.
 2 days ago - ChartmillDespite its growth, ALPHABET INC-CL C (NASDAQ:GOOG) remains within the realm of affordability.
ALPHABET INC-CL C could be undervalued. NASDAQ:GOOG is scoring impressively in terms of growth while demonstrating strong financials. On top of that, it remains attractively priced.
 13 days ago - ChartmillDiscover the top S&P500 movers in Monday's pre-market session.
The US market is yet to commence its session on Monday, but let's get a preview of the pre-market session and explore the top S&P500 gainers and losers driving the early market movements.
