While growth is established for GLOBUS MEDICAL INC - A (NYSE:GMED), the stock's valuation remains reasonable.
By Mill Chart
Last update: Apr 21, 2025
Take a closer look at GLOBUS MEDICAL INC - A (NYSE:GMED), an affordable growth stock uncovered by our stock screener. GMED boasts strong growth prospects and excels in financial health indicators, all while maintaining a reasonable valuation. Let's break it down further.
Growth Assessment of GMED
ChartMill assigns a Growth Rating to every stock. This score ranges from 0 to 10 and evaluates the different growth aspects like EPS and Revenue, both in the past as in the future. GMED scores a 7 out of 10:
- GMED shows a strong growth in Earnings Per Share. In the last year, the EPS has been growing by 34.76%, which is quite impressive.
- Measured over the past years, GMED shows a quite strong growth in Earnings Per Share. The EPS has been growing by 13.19% on average per year.
- The Revenue has grown by 60.63% in the past year. This is a very strong growth!
- The Revenue has been growing by 26.25% on average over the past years. This is a very strong growth!
- Based on estimates for the next years, GMED will show a quite strong growth in Earnings Per Share. The EPS will grow by 12.10% on average per year.
A Closer Look at Valuation for GMED
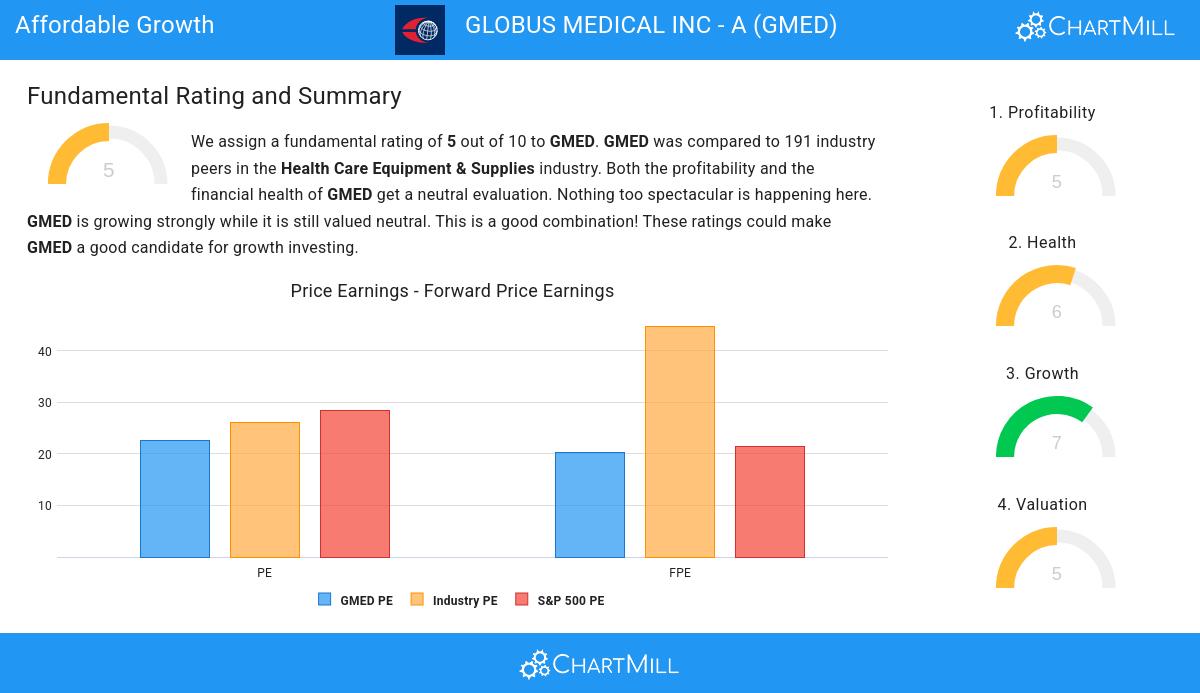
To assess a stock's valuation, ChartMill utilizes a Valuation Rating on a scale of 0 to 10. This comprehensive assessment considers various valuation aspects, comparing price to earnings and cash flows, while factoring in profitability and growth. GMED has achieved a 5 out of 10:
- 79.06% of the companies in the same industry are more expensive than GMED, based on the Price/Earnings ratio.
- GMED is valuated rather cheaply when we compare the Price/Earnings ratio to 28.29, which is the current average of the S&P500 Index.
- GMED's Price/Forward Earnings ratio is rather cheap when compared to the industry. GMED is cheaper than 80.63% of the companies in the same industry.
- Based on the Enterprise Value to EBITDA ratio, GMED is valued a bit cheaper than 74.87% of the companies in the same industry.
- Based on the Price/Free Cash Flow ratio, GMED is valued cheaply inside the industry as 83.77% of the companies are valued more expensively.
- A more expensive valuation may be justified as GMED's earnings are expected to grow with 13.05% in the coming years.
Analyzing Health Metrics
ChartMill utilizes a Health Rating to assess stocks, scoring them on a scale of 0 to 10. This rating takes into account a variety of liquidity and solvency ratios, both in absolute terms and in comparison to industry peers. GMED has earned a 6 out of 10:
- An Altman-Z score of 6.68 indicates that GMED is not in any danger for bankruptcy at the moment.
- GMED has a Altman-Z score of 6.68. This is amongst the best in the industry. GMED outperforms 86.39% of its industry peers.
- GMED has a debt to FCF ratio of 1.10. This is a very positive value and a sign of high solvency as it would only need 1.10 years to pay back of all of its debts.
- GMED has a Debt to FCF ratio of 1.10. This is amongst the best in the industry. GMED outperforms 92.15% of its industry peers.
- A Debt/Equity ratio of 0.00 indicates that GMED is not too dependend on debt financing.
- GMED has a Debt to Equity ratio of 0.00. This is in the better half of the industry: GMED outperforms 71.20% of its industry peers.
- A Current Ratio of 2.54 indicates that GMED has no problem at all paying its short term obligations.
Profitability Insights: GMED
ChartMill's Profitability Rating offers a unique perspective on stock analysis, providing scores from 0 to 10. These ratings consider a wide range of profitability metrics and margins, both in comparison to industry peers and on their own merits. For GMED, the assigned 5 is a significant indicator of profitability:
- GMED's Return On Assets of 1.96% is fine compared to the rest of the industry. GMED outperforms 75.92% of its industry peers.
- GMED's Return On Equity of 2.47% is fine compared to the rest of the industry. GMED outperforms 76.96% of its industry peers.
- GMED has a better Return On Invested Capital (3.99%) than 75.39% of its industry peers.
- The Profit Margin of GMED (4.09%) is better than 76.44% of its industry peers.
- GMED has a better Operating Margin (8.72%) than 77.49% of its industry peers.
Every day, new Affordable Growth stocks can be found on ChartMill in our Affordable Growth screener.
Our latest full fundamental report of GMED contains the most current fundamental analsysis.
Keep in mind
Important Note: The content of this article is not intended as trading advice. It is essential to perform your own analysis and exercise caution when making trading decisions. The article presents observations created by automated analysis but does not guarantee any trading or investment outcomes. Always trade responsibly and make independent judgments.
71.01
-0.13 (-0.18%)
Find more stocks in the Stock Screener
GMED Latest News and Analysis
 2 minutes ago - ChartmillWhile growth is established for GLOBUS MEDICAL INC - A (NYSE:GMED), the stock's valuation remains reasonable.
Based on Fundamental Analysis it can be said that NYSE:GMED is a growth stock which is not overvalued.
