Investors should take note of NYSE:GMED, a growth stock that remains attractively priced.
By Mill Chart
Last update: Feb 7, 2025
GLOBUS MEDICAL INC - A (NYSE:GMED) was identified as an affordable growth stock by our stock screener. NYSE:GMED is showing great growth, but also scores well on profitability, solvency and liquidity. At the same time it seems to be priced reasonably. We'll explore this a bit deeper below.
How We Gauge Growth for NYSE:GMED
ChartMill assigns a Growth Rating to each stock, ranging from 0 to 10. This rating is determined by analyzing different growth elements, including EPS and revenue growth, spanning both historical and future figures. In the case of NYSE:GMED, the assigned 7 reflects its growth potential:
- GMED shows a strong growth in Earnings Per Share. In the last year, the EPS has been growing by 25.00%, which is quite impressive.
- GMED shows a strong growth in Revenue. In the last year, the Revenue has grown by 102.10%.
- The Revenue has been growing by 17.08% on average over the past years. This is quite good.
- The Earnings Per Share is expected to grow by 16.44% on average over the next years. This is quite good.
- GMED is expected to show quite a strong growth in Revenue. In the coming years, the Revenue will grow by 16.33% yearly.
- The EPS growth rate is accelerating: in the next years the growth will be better than in the last years.
Looking at the Valuation
ChartMill assigns a Valuation Rating to every stock. This score ranges from 0 to 10 and evaluates the different valuation aspects and compares the price to earnings and cash flows, while taking into account profitability and growth. NYSE:GMED scores a 5 out of 10:
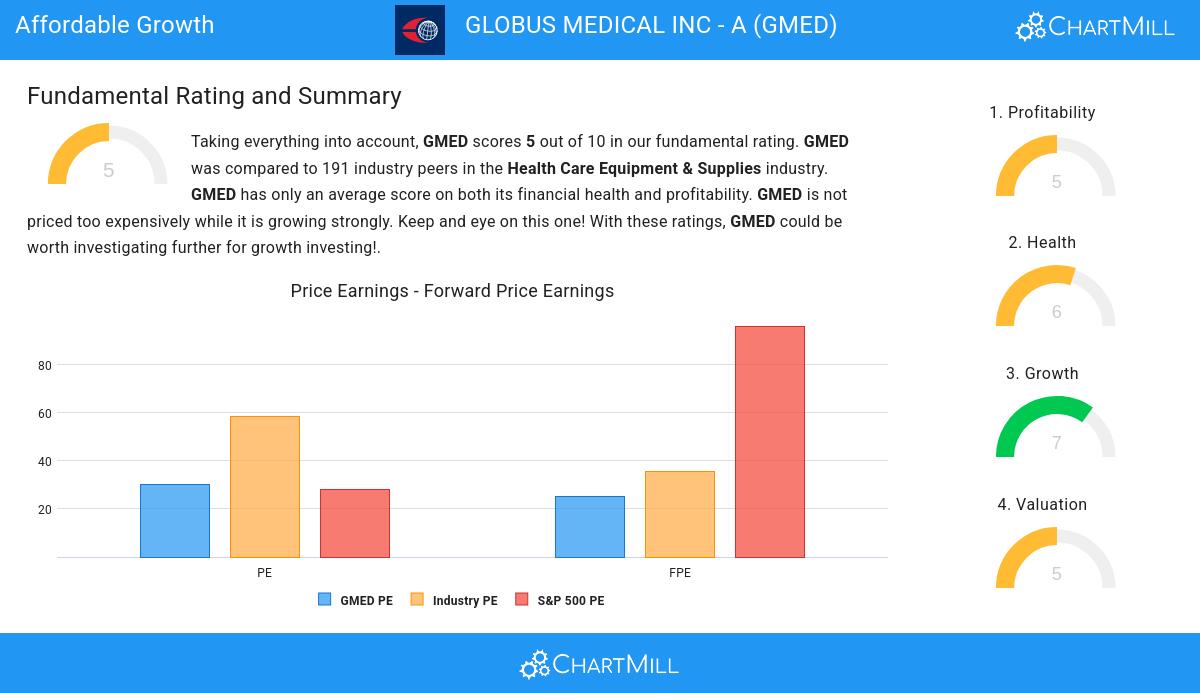
- 75.26% of the companies in the same industry are more expensive than GMED, based on the Price/Earnings ratio.
- Compared to the rest of the industry, the Price/Forward Earnings ratio of GMED indicates a somewhat cheap valuation: GMED is cheaper than 77.37% of the companies listed in the same industry.
- The average S&P500 Price/Forward Earnings ratio is at 96.20. GMED is valued rather cheaply when compared to this.
- Based on the Enterprise Value to EBITDA ratio, GMED is valued a bit cheaper than the industry average as 71.05% of the companies are valued more expensively.
- Based on the Price/Free Cash Flow ratio, GMED is valued a bit cheaper than the industry average as 76.84% of the companies are valued more expensively.
- GMED's low PEG Ratio(NY), which compensates the Price/Earnings for growth, indicates a rather cheap valuation of the company.
- A more expensive valuation may be justified as GMED's earnings are expected to grow with 19.81% in the coming years.
Health Assessment of NYSE:GMED
ChartMill employs a unique Health Rating system for all stocks. This rating, ranging from 0 to 10, is determined by analyzing various liquidity and solvency ratios. For NYSE:GMED, the assigned 6 for health provides valuable insights:
- GMED has an Altman-Z score of 9.43. This indicates that GMED is financially healthy and has little risk of bankruptcy at the moment.
- GMED's Altman-Z score of 9.43 is amongst the best of the industry. GMED outperforms 87.89% of its industry peers.
- GMED has a debt to FCF ratio of 1.49. This is a very positive value and a sign of high solvency as it would only need 1.49 years to pay back of all of its debts.
- GMED has a Debt to FCF ratio of 1.49. This is amongst the best in the industry. GMED outperforms 88.42% of its industry peers.
- GMED has a Debt/Equity ratio of 0.00. This is a healthy value indicating a solid balance between debt and equity.
- GMED has a better Debt to Equity ratio (0.00) than 70.00% of its industry peers.
- GMED has a Current Ratio of 2.51. This indicates that GMED is financially healthy and has no problem in meeting its short term obligations.
Looking at the Profitability
ChartMill assigns a Profitability Rating to every stock. This score ranges from 0 to 10 and evaluates the different profitability ratios and margins, both absolutely, but also relative to the industry peers. NYSE:GMED scores a 5 out of 10:
- Looking at the Return On Assets, with a value of 1.80%, GMED is in the better half of the industry, outperforming 73.16% of the companies in the same industry.
- GMED's Return On Equity of 2.25% is fine compared to the rest of the industry. GMED outperforms 74.21% of its industry peers.
- With a decent Return On Invested Capital value of 3.01%, GMED is doing good in the industry, outperforming 73.16% of the companies in the same industry.
- Looking at the Profit Margin, with a value of 3.69%, GMED is in the better half of the industry, outperforming 74.21% of the companies in the same industry.
- GMED's Operating Margin of 6.80% is fine compared to the rest of the industry. GMED outperforms 74.21% of its industry peers.
Our Affordable Growth screener lists more Affordable Growth stocks and is updated daily.
Check the latest full fundamental report of GMED for a complete fundamental analysis.
Disclaimer
This article should in no way be interpreted as advice. The article is based on the observed metrics at the time of writing, but you should always make your own analysis and trade or invest at your own responsibility.
GLOBUS MEDICAL INC - A
NYSE:GMED (2/11/2025, 12:17:46 PM)
84.655
-2.72 (-3.12%)
GMED Latest News and Analysis
 4 days ago - ChartmillInvestors should take note of NYSE:GMED, a growth stock that remains attractively priced.
Based on Fundamental Analysis it can be said that NYSE:GMED is a growth stock which is not overvalued.
 13 days ago - ChartmillWhy NYSE:GMED is Poised for High Growth.
A fundamental and technical analysis of (NYSE:GMED): Exploring GLOBUS MEDICAL INC - A (NYSE:GMED)'s high growth characteristics.
