
NASDAQ:GMAB: a strong growth stock preparing for the next leg up?.
By Mill Chart
Last update: Jan 28, 2025
Groth investors are looking for stocks showing high revenue and EPS growth. We will have a look here to see if GENMAB A/S -SP ADR (NASDAQ:GMAB) is suited for growth investing, while it is forming a base and may be ready to breakout. Investors should of course do their own research, but we spotted GENMAB A/S -SP ADR showing up in our growth with base formation screen, so it may be worth spending some more time on it.
What does the Growth looks like for NASDAQ:GMAB
ChartMill assigns a proprietary Growth Rating to each stock. The score is computed by evaluating various growth aspects, like EPS and revenue growth. We take into account the history as well as the estimated future numbers. NASDAQ:GMAB was assigned a score of 8 for growth:
- The Earnings Per Share has grown by an nice 9.57% over the past year.
- GMAB shows a strong growth in Earnings Per Share. Measured over the last years, the EPS has been growing by 22.70% yearly.
- GMAB shows quite a strong growth in Revenue. In the last year, the Revenue has grown by 13.57%.
- Measured over the past years, GMAB shows a very strong growth in Revenue. The Revenue has been growing by 40.35% on average per year.
- Based on estimates for the next years, GMAB will show a very strong growth in Earnings Per Share. The EPS will grow by 23.97% on average per year.
- GMAB is expected to show quite a strong growth in Revenue. In the coming years, the Revenue will grow by 18.31% yearly.
Health Assessment of NASDAQ:GMAB
ChartMill employs a unique Health Rating system for all stocks. This rating, ranging from 0 to 10, is determined by analyzing various liquidity and solvency ratios. For NASDAQ:GMAB, the assigned 7 for health provides valuable insights:
- GMAB has an Altman-Z score of 9.55. This indicates that GMAB is financially healthy and has little risk of bankruptcy at the moment.
- With an excellent Altman-Z score value of 9.55, GMAB belongs to the best of the industry, outperforming 86.02% of the companies in the same industry.
- GMAB has a debt to FCF ratio of 0.16. This is a very positive value and a sign of high solvency as it would only need 0.16 years to pay back of all of its debts.
- The Debt to FCF ratio of GMAB (0.16) is better than 97.35% of its industry peers.
- A Debt/Equity ratio of 0.03 indicates that GMAB is not too dependend on debt financing.
- A Current Ratio of 5.03 indicates that GMAB has no problem at all paying its short term obligations.
- GMAB has a Quick Ratio of 5.02. This indicates that GMAB is financially healthy and has no problem in meeting its short term obligations.
Exploring NASDAQ:GMAB's Profitability
ChartMill utilizes a Profitability Rating to assess stocks, scoring them on a scale of 0 to 10. This rating takes into account a variety of profitability ratios and margins, both in absolute terms and in comparison to industry peers. NASDAQ:GMAB has earned a 8 out of 10:
- The Return On Assets of GMAB (14.25%) is better than 97.52% of its industry peers.
- GMAB has a Return On Equity of 17.77%. This is amongst the best in the industry. GMAB outperforms 96.81% of its industry peers.
- GMAB's Return On Invested Capital of 13.65% is amongst the best of the industry. GMAB outperforms 96.64% of its industry peers.
- The last Return On Invested Capital (13.65%) for GMAB is above the 3 year average (13.32%), which is a sign of increasing profitability.
- GMAB has a better Profit Margin (29.01%) than 98.05% of its industry peers.
- The Operating Margin of GMAB (31.65%) is better than 98.94% of its industry peers.
- GMAB's Gross Margin of 96.83% is amongst the best of the industry. GMAB outperforms 96.81% of its industry peers.
Looking at the Setup
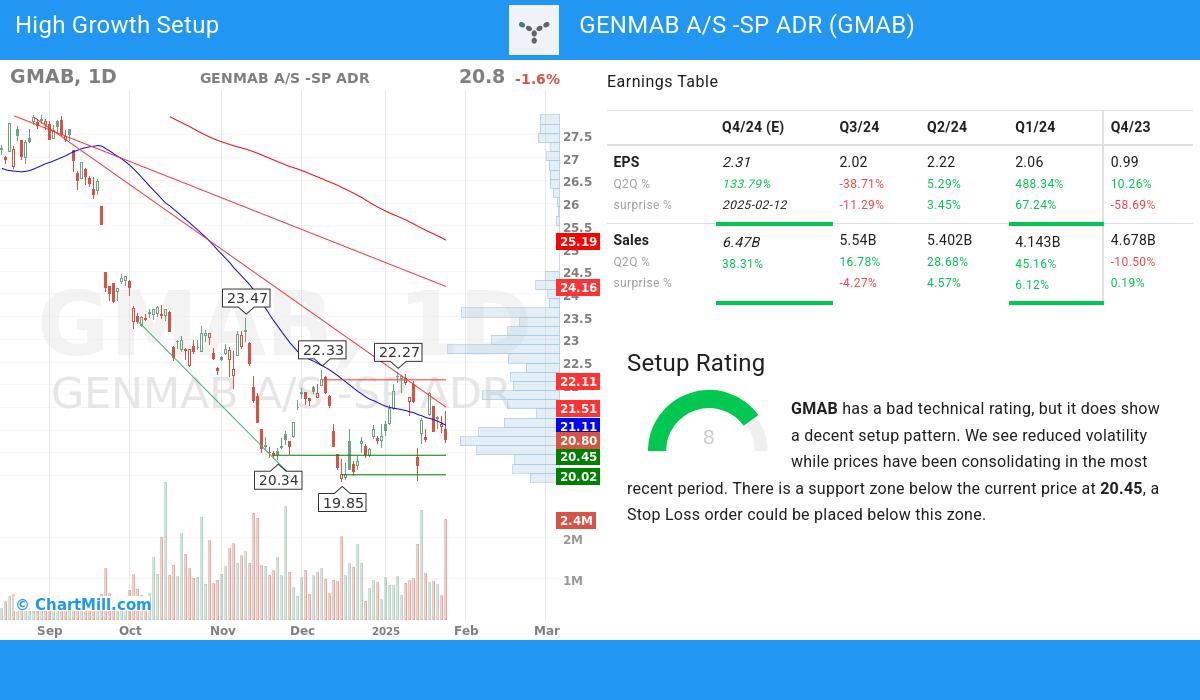
Besides the Technical Rating, ChartMill also assign a Setup Rating to every stock. This setup score also ranges from 0 to 10 and determines to which extend the stock is consolidating. This is achieved by evaluating multiple short term technical indicators. NASDAQ:GMAB currently has a 8 as setup rating:
GMAB has a bad technical rating, but it does show a decent setup pattern. Prices have been consolidating lately and the volatility has been reduced. There is a support zone below the current price at 20.45, a Stop Loss order could be placed below this zone.
Our Strong Growth screener lists more Strong Growth stocks and is updated daily.
Our latest full fundamental report of GMAB contains the most current fundamental analsysis.
Our latest full technical report of GMAB contains the most current technical analsysis.
Disclaimer
This article should in no way be interpreted as advice. The article is based on the observed metrics at the time of writing, but you should always make your own analysis and trade or invest at your own responsibility.