
GENPACT LTD (NYSE:G) appears to be flying under the radar despite its strong fundamentals.
By Mill Chart
Last update: Mar 10, 2025
GENPACT LTD (NYSE:G) is a hidden gem identified by our stock screening tool, featuring undervaluation and robust fundamentals. NYSE:G showcases decent financial health and profitability, coupled with an attractive price. Let's dig deeper into the analysis.
Valuation Assessment of NYSE:G
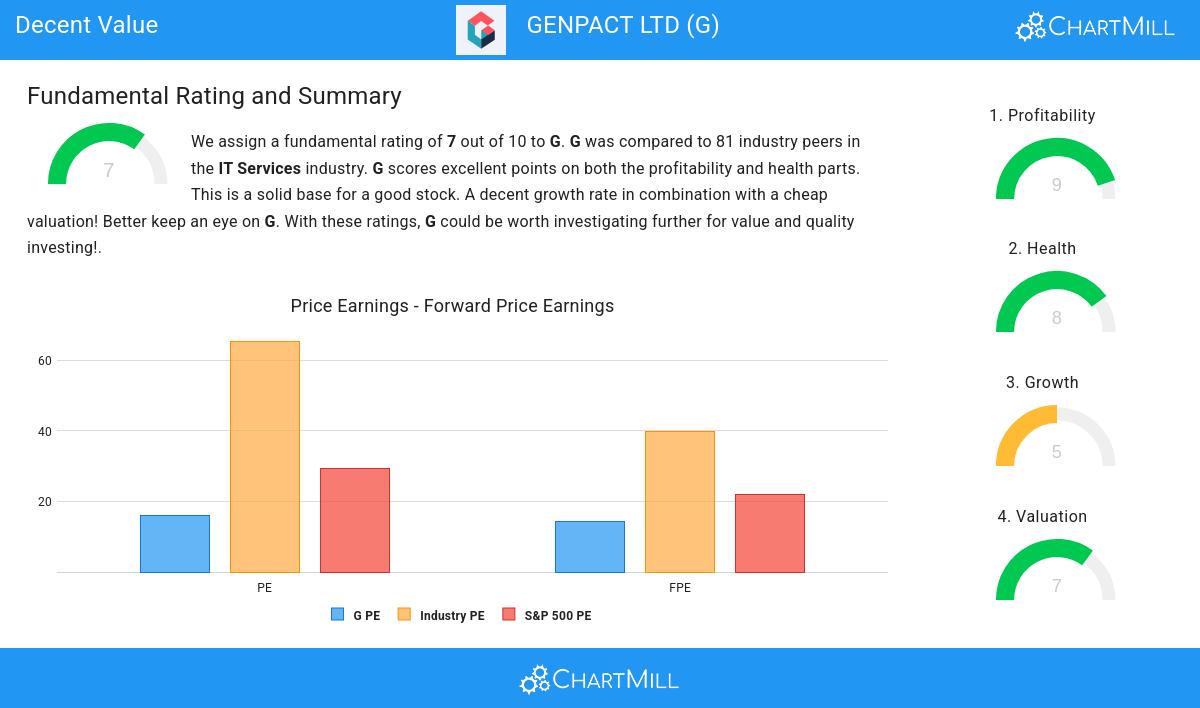
An integral part of ChartMill's stock analysis is the Valuation Rating, which spans from 0 to 10. This rating evaluates diverse valuation factors, including price to earnings and cash flows, while considering the stock's profitability and growth. NYSE:G has received a 7 out of 10:
- Compared to the rest of the industry, the Price/Earnings ratio of G indicates a rather cheap valuation: G is cheaper than 80.25% of the companies listed in the same industry.
- The average S&P500 Price/Earnings ratio is at 29.35. G is valued slightly cheaper when compared to this.
- 81.48% of the companies in the same industry are more expensive than G, based on the Price/Forward Earnings ratio.
- G's Price/Forward Earnings ratio indicates a valuation a bit cheaper than the S&P500 average which is at 22.10.
- 74.07% of the companies in the same industry are more expensive than G, based on the Enterprise Value to EBITDA ratio.
- G's Price/Free Cash Flow ratio is rather cheap when compared to the industry. G is cheaper than 82.72% of the companies in the same industry.
- The excellent profitability rating of G may justify a higher PE ratio.
Evaluating Profitability: NYSE:G
ChartMill's Profitability Rating offers a unique perspective on stock analysis, providing scores from 0 to 10. These ratings consider a wide range of profitability metrics and margins, both in comparison to industry peers and on their own merits. For NYSE:G, the assigned 9 is a significant indicator of profitability:
- G's Return On Assets of 10.30% is amongst the best of the industry. G outperforms 86.42% of its industry peers.
- G's Return On Equity of 21.50% is amongst the best of the industry. G outperforms 85.19% of its industry peers.
- Looking at the Return On Invested Capital, with a value of 13.24%, G belongs to the top of the industry, outperforming 85.19% of the companies in the same industry.
- The Average Return On Invested Capital over the past 3 years for G is above the industry average of 10.52%.
- The last Return On Invested Capital (13.24%) for G is above the 3 year average (12.82%), which is a sign of increasing profitability.
- G's Profit Margin of 10.78% is amongst the best of the industry. G outperforms 80.25% of its industry peers.
- In the last couple of years the Profit Margin of G has grown nicely.
- G has a Operating Margin of 14.73%. This is amongst the best in the industry. G outperforms 83.95% of its industry peers.
- G's Operating Margin has improved in the last couple of years.
Assessing Health for NYSE:G
To gauge a stock's financial health, ChartMill utilizes a Health Rating on a scale of 0 to 10. This comprehensive evaluation encompasses liquidity and solvency, both in absolute terms and in comparison to industry peers. NYSE:G has earned a 8 out of 10:
- An Altman-Z score of 4.13 indicates that G is not in any danger for bankruptcy at the moment.
- G has a better Altman-Z score (4.13) than 67.90% of its industry peers.
- The Debt to FCF ratio of G is 2.30, which is a good value as it means it would take G, 2.30 years of fcf income to pay off all of its debts.
- G's Debt to FCF ratio of 2.30 is fine compared to the rest of the industry. G outperforms 66.67% of its industry peers.
- Even though the debt/equity ratio score it not favorable for G, it has very limited outstanding debt, so we won't put too much weight on the DE evaluation.
- A Current Ratio of 2.16 indicates that G has no problem at all paying its short term obligations.
- G's Current ratio of 2.16 is fine compared to the rest of the industry. G outperforms 72.84% of its industry peers.
- G has a Quick Ratio of 2.16. This indicates that G is financially healthy and has no problem in meeting its short term obligations.
- G has a better Quick ratio (2.16) than 72.84% of its industry peers.
Growth Assessment of NYSE:G
Every stock receives a Growth Rating from ChartMill, ranging from 0 to 10. This rating assesses various growth aspects, including historical and projected EPS and revenue growth. NYSE:G boasts a 5 out of 10:
- Measured over the past years, G shows a quite strong growth in Earnings Per Share. The EPS has been growing by 9.38% on average per year.
- Based on estimates for the next years, G will show a quite strong growth in Earnings Per Share. The EPS will grow by 11.11% on average per year.
- The Revenue growth rate is accelerating: in the next years the growth will be better than in the last years.
Our Decent Value screener lists more Decent Value stocks and is updated daily.
Our latest full fundamental report of G contains the most current fundamental analsysis.
Disclaimer
Important Note: The content of this article is not intended as trading advice. It is essential to perform your own analysis and exercise caution when making trading decisions. The article presents observations created by automated analysis but does not guarantee any trading or investment outcomes. Always trade responsibly and make independent judgments.
