
Based on good technical signals, GENPACT LTD is potentially setting up for a breakout.
By Mill Chart
Last update: Sep 24, 2024
Our stockscreener has identified a possible breakout setup on GENPACT LTD (NYSE:G). This occurs when the stock consolidates following a significant upward movement. While the breakout outcome cannot be guaranteed, it may be worth monitoring NYSE:G for potential opportunities.
Analyzing the Technical Aspects
ChartMill employs a sophisticated system to assign a Technical Rating to every stock in its analysis. This rating, which ranges from 0 to 10, is determined by carefully assessing multiple technical indicators and properties.
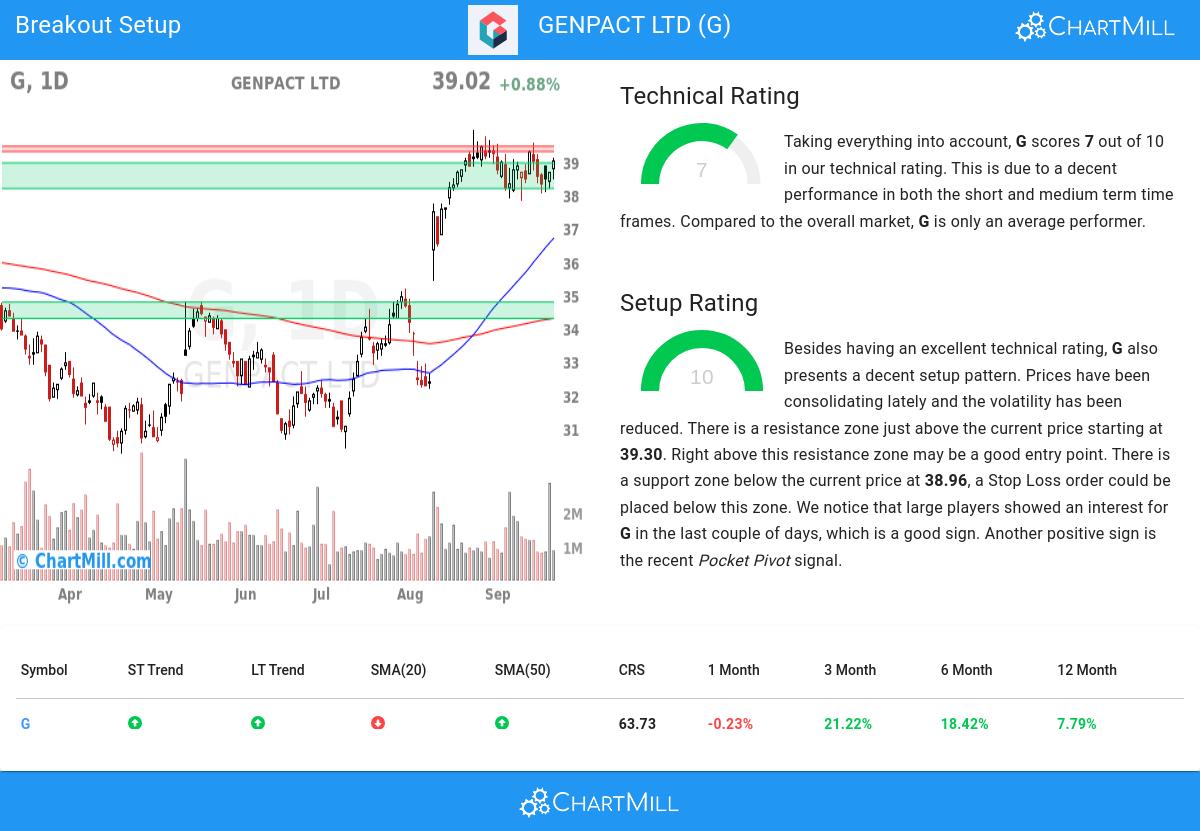
Overall G gets a technical rating of 7 out of 10. This is due to a decent performance in both the short and medium term time frames. Compared to the overall market, G is only an average performer.
- The long and short term trends are both positive. This is looking good!
- G is currently trading in the upper part of its 52 week range. The S&P500 Index however is currently trading near a new high, so G is lagging the market slightly.
- G is currently showing a bull flag pattern! A bull flag pattern occurs when prices pull back slightly after a strong rise up. This may be a nice opportunity for an entry.
- When compared to the yearly performance of all other stocks, G outperforms 63% of them, which is more or less in line with the market.
- G is part of the IT Services industry. There are 87 other stocks in this industry, G did better than 69% of them.
- In the last month G has a been trading in a tight range between 37.83 and 39.77.
Our latest full technical report of G contains the most current technical analsysis.
How do we evaluate the setup for NYSE:G?
In addition to the Technical Rating, ChartMill provides a Setup Rating for each stock. This rating, ranging from 0 to 10, assesses the level of consolidation in the stock based on multiple short-term technical indicators. Currently, NYSE:G has a 10 as its setup rating, indicating its current consolidation status.
G has an excellent technical rating and also presents a decent setup pattern. We see reduced volatility while prices have been consolidating in the most recent period. There is a resistance zone just above the current price starting at 39.30. Right above this resistance zone may be a good entry point. There is a support zone below the current price at 38.96, a Stop Loss order could be placed below this zone. We notice that large players showed an interest for G in the last couple of days, which is a good sign. Very recently a Pocket Pivot signal was observed. This is another positive sign.
Trading breakout setups.
A breakout could materialize when the stock breaks out to new highs above the current consolidation zone. One could wait for this to happen and buy when this happens. A stop loss could be placed below the consolidation zone.
Please note that this article should not be construed as trading advice. The information provided is solely based on automated technical analysis and serves to highlight technical observations. It is important to conduct your own analysis and make trading decisions based on your own judgment and responsibility.
More breakout setups can be found in our Breakout screener.
Disclaimer
This is not investing advice! The article highlights some of the observations at the time of writing, but you should always make your own analysis and invest based on your own insights.