
NYSE:G: good value for what you're paying.
By Mill Chart
Last update: Sep 4, 2024
Discover GENPACT LTD (NYSE:G), an undervalued stock highlighted by our stock screener. NYSE:G showcases solid financial health and profitability while maintaining an appealing valuation. We'll explore the details.
How do we evaluate the Valuation for NYSE:G?
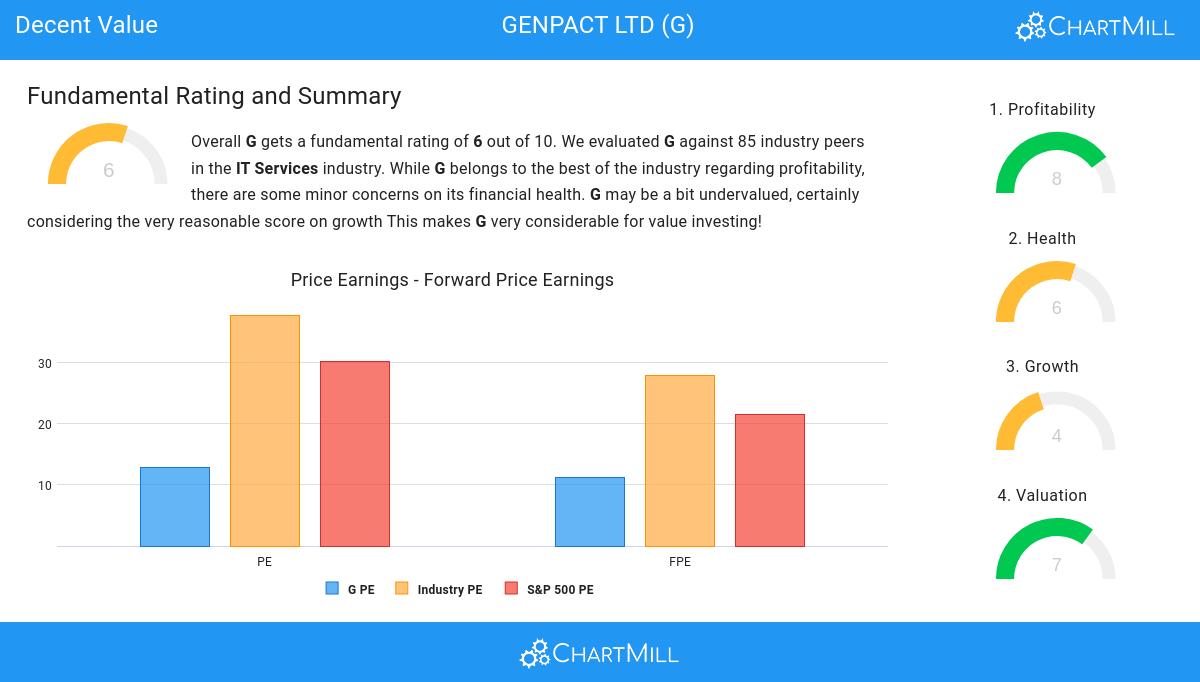
An integral part of ChartMill's stock analysis is the Valuation Rating, which spans from 0 to 10. This rating evaluates diverse valuation factors, including price to earnings and cash flows, while considering the stock's profitability and growth. NYSE:G has received a 7 out of 10:
- Based on the Price/Earnings ratio, G is valued cheaply inside the industry as 85.54% of the companies are valued more expensively.
- G's Price/Earnings ratio indicates a rather cheap valuation when compared to the S&P500 average which is at 30.14.
- G is valuated reasonably with a Price/Forward Earnings ratio of 11.23.
- G's Price/Forward Earnings ratio is rather cheap when compared to the industry. G is cheaper than 87.95% of the companies in the same industry.
- G is valuated rather cheaply when we compare the Price/Forward Earnings ratio to 21.56, which is the current average of the S&P500 Index.
- Based on the Enterprise Value to EBITDA ratio, G is valued a bit cheaper than the industry average as 77.11% of the companies are valued more expensively.
- G's Price/Free Cash Flow ratio is rather cheap when compared to the industry. G is cheaper than 80.72% of the companies in the same industry.
- The excellent profitability rating of G may justify a higher PE ratio.
What does the Profitability looks like for NYSE:G
ChartMill assigns a proprietary Profitability Rating to each stock. The score is computed by evaluating various profitability ratios and margins and ranges from 0 to 10. NYSE:G was assigned a score of 8 for profitability:
- G has a better Return On Assets (12.51%) than 93.98% of its industry peers.
- G has a Return On Equity of 27.71%. This is amongst the best in the industry. G outperforms 92.77% of its industry peers.
- The Return On Invested Capital of G (12.57%) is better than 85.54% of its industry peers.
- The last Return On Invested Capital (12.57%) for G is above the 3 year average (11.94%), which is a sign of increasing profitability.
- G's Profit Margin of 14.12% is amongst the best of the industry. G outperforms 91.57% of its industry peers.
- In the last couple of years the Profit Margin of G has grown nicely.
- G has a better Operating Margin (14.35%) than 81.93% of its industry peers.
- In the last couple of years the Operating Margin of G has grown nicely.
Health Insights: NYSE:G
Every stock is evaluated by ChartMill, receiving a Health Rating on a scale of 0 to 10. This assessment considers different health aspects, including liquidity and solvency, both in absolute terms and relative to industry peers. NYSE:G has achieved a 6 out of 10:
- An Altman-Z score of 3.34 indicates that G is not in any danger for bankruptcy at the moment.
- With a decent Altman-Z score value of 3.34, G is doing good in the industry, outperforming 65.06% of the companies in the same industry.
- The Debt to FCF ratio of G is 3.60, which is a good value as it means it would take G, 3.60 years of fcf income to pay off all of its debts.
- G has a better Current ratio (1.89) than 61.45% of its industry peers.
- Looking at the Quick ratio, with a value of 1.89, G is in the better half of the industry, outperforming 61.45% of the companies in the same industry.
Assessing Growth Metrics for NYSE:G
ChartMill assigns a Growth Rating to every stock. This score ranges from 0 to 10 and evaluates the different growth aspects like EPS and Revenue, both in the past as in the future. NYSE:G scores a 4 out of 10:
- The Earnings Per Share has been growing by 10.61% on average over the past years. This is quite good.
- G shows quite a strong growth in Revenue. Measured over the last years, the Revenue has been growing by 8.33% yearly.
- The Earnings Per Share is expected to grow by 8.42% on average over the next years. This is quite good.
Our Decent Value screener lists more Decent Value stocks and is updated daily.
For an up to date full fundamental analysis you can check the fundamental report of G
Disclaimer
This is not investing advice! The article highlights some of the observations at the time of writing, but you should always make your own analysis and invest based on your own insights.