
FORTINET INC (NASDAQ:FTNT): a strong growth stock preparing for the next leg up?.
By Mill Chart
Last update: Mar 28, 2025
For growth-minded investors, high revenue and EPS growth are key criteria. Today, we'll examine whether FORTINET INC (NASDAQ:FTNT) fits the bill for growth investing, particularly as it forms a base and hints at a potential breakout. Remember, due diligence is essential, but FORTINET INC has caught our attention on our screen for growth with base formation. It may warrant additional investigation.
Understanding FTNT's Growth
ChartMill assigns a Growth Rating to every stock. This score ranges from 0 to 10 and evaluates the different growth aspects like EPS and Revenue, both in the past as in the future. FTNT scores a 8 out of 10:
- The Earnings Per Share has grown by an impressive 44.51% over the past year.
- The Earnings Per Share has been growing by 36.84% on average over the past years. This is a very strong growth
- FTNT shows quite a strong growth in Revenue. In the last year, the Revenue has grown by 12.27%.
- FTNT shows a strong growth in Revenue. Measured over the last years, the Revenue has been growing by 22.46% yearly.
- Based on estimates for the next years, FTNT will show a quite strong growth in Earnings Per Share. The EPS will grow by 9.09% on average per year.
- FTNT is expected to show quite a strong growth in Revenue. In the coming years, the Revenue will grow by 13.70% yearly.
ChartMill's Evaluation of Health
ChartMill assigns a proprietary Health Rating to each stock. The score is computed by evaluating various liquidity and solvency ratios and ranges from 0 to 10. FTNT was assigned a score of 8 for health:
- An Altman-Z score of 6.99 indicates that FTNT is not in any danger for bankruptcy at the moment.
- FTNT has a Altman-Z score of 6.99. This is in the better half of the industry: FTNT outperforms 77.06% of its industry peers.
- FTNT has a debt to FCF ratio of 0.53. This is a very positive value and a sign of high solvency as it would only need 0.53 years to pay back of all of its debts.
- FTNT has a Debt to FCF ratio of 0.53. This is in the better half of the industry: FTNT outperforms 76.34% of its industry peers.
- Even though the debt/equity ratio score it not favorable for FTNT, it has very limited outstanding debt, so we won't put too much weight on the DE evaluation.
- The current and quick ratio evaluation for FTNT is rather negative, while it does have excellent solvency and profitability. These ratios do not necessarly indicate liquidity issues and need to be evaluated against the specifics of the business.
A Closer Look at Profitability for FTNT
Discover ChartMill's exclusive Profitability Rating, a proprietary metric that assesses stocks on a scale of 0 to 10. It takes into consideration various profitability ratios and margins, both in absolute terms and relative to industry peers. Notably, FTNT has achieved a 9:
- FTNT's Return On Assets of 17.88% is amongst the best of the industry. FTNT outperforms 94.27% of its industry peers.
- The Return On Equity of FTNT (116.83%) is better than 99.28% of its industry peers.
- FTNT has a Return On Invested Capital of 27.67%. This is amongst the best in the industry. FTNT outperforms 97.13% of its industry peers.
- Measured over the past 3 years, the Average Return On Invested Capital for FTNT is significantly above the industry average of 10.64%.
- FTNT has a better Profit Margin (29.30%) than 92.83% of its industry peers.
- FTNT's Profit Margin has improved in the last couple of years.
- FTNT has a better Operating Margin (30.20%) than 94.62% of its industry peers.
- FTNT's Operating Margin has improved in the last couple of years.
- With an excellent Gross Margin value of 80.56%, FTNT belongs to the best of the industry, outperforming 82.44% of the companies in the same industry.
How do we evaluate the setup for FTNT?
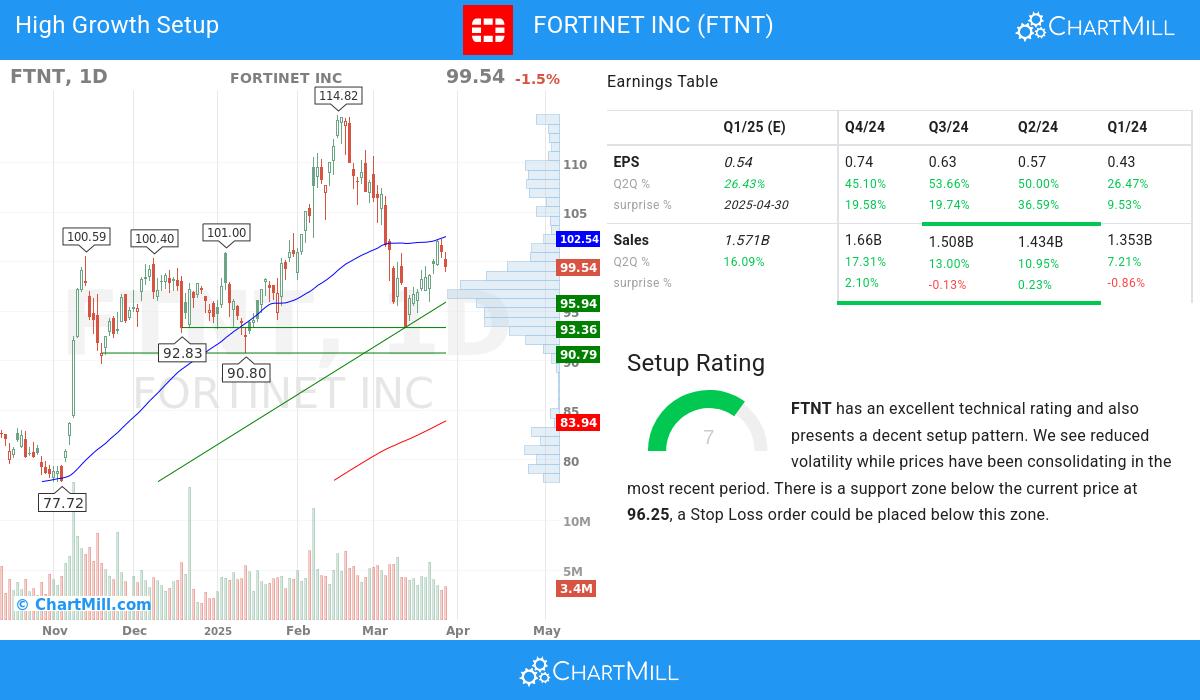
ChartMill also assigns a Setup Rating to each stock. This rating, on a scale of 0 to 10, reflects the degree of consolidation observed based on short-term technical indicators. Currently, FTNT exhibits a 7 setup rating, indicating its consolidation status in recent days and weeks.
Besides having an excellent technical rating, FTNT also presents a decent setup pattern. We see reduced volatility while prices have been consolidating in the most recent period. There is a support zone below the current price at 96.25, a Stop Loss order could be placed below this zone.
Every day, new Strong Growth stocks can be found on ChartMill in our Strong Growth screener.
For an up to date full fundamental analysis you can check the fundamental report of FTNT
Check the latest full technical report of FTNT for a complete technical analysis.
Keep in mind
Important Note: The content of this article is not intended as trading advice. It is essential to perform your own analysis and exercise caution when making trading decisions. The article presents observations created by automated analysis but does not guarantee any trading or investment outcomes. Always trade responsibly and make independent judgments.
