
NASDAQ:FTNT may be ready to breakout.
By Mill Chart
Last update: Sep 27, 2024
Our stock screener has identified FORTINET INC (NASDAQ:FTNT) as a potential breakout candidate. This technical breakout setup pattern occurs when the stock consolidates after a strong uptrend. While the actual breakout is uncertain, it may be worth keeping an eye on NASDAQ:FTNT.
In-Depth Technical Analysis of NASDAQ:FTNT
ChartMill assigns a Technical Rating to every stock. This score ranges from 0 to 10 and is updated daily. The score is determined by evaluating multiple technical indicators and properties.
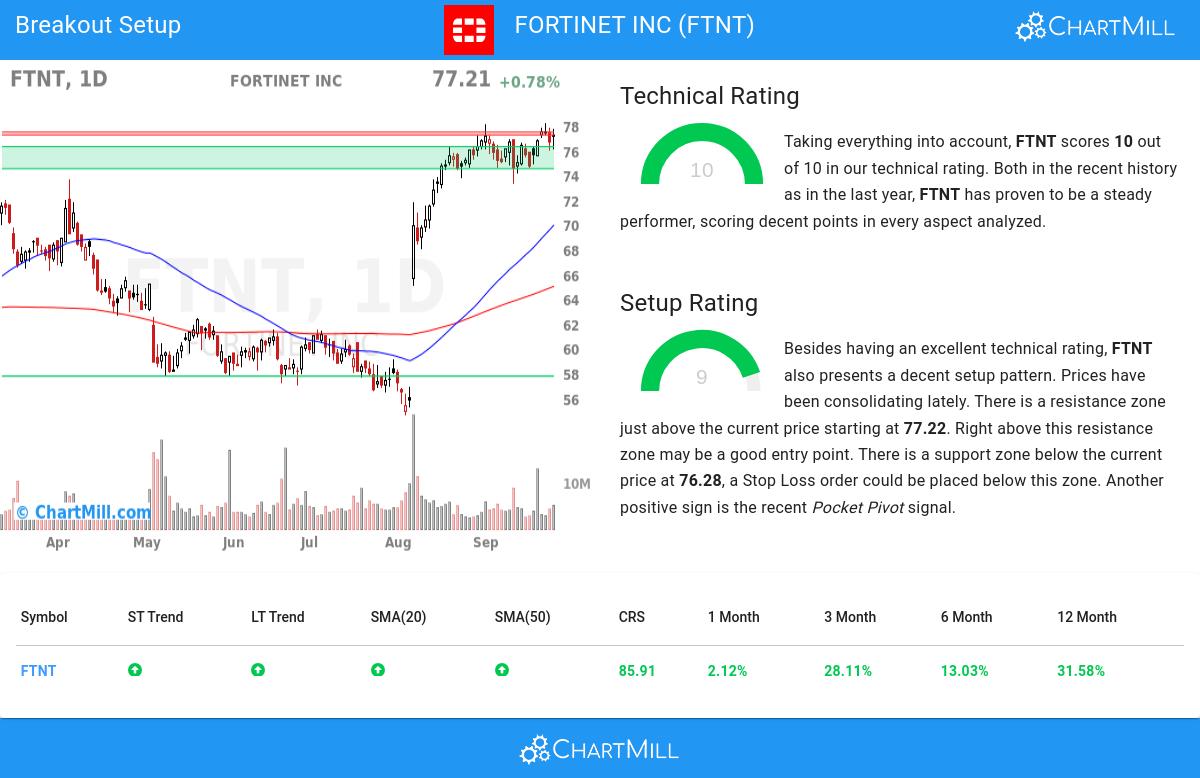
We assign a technical rating of 10 out of 10 to FTNT. Both in the recent history as in the last year, FTNT has proven to be a steady performer, scoring decent points in every aspect analyzed.
- Both the short term and long term trends are positive. This is a very positive sign.
- Looking at the yearly performance, FTNT did better than 85% of all other stocks.
- FTNT is part of the Software industry. There are 282 other stocks in this industry. FTNT outperforms 75% of them.
- FTNT is currently trading near its 52 week high, which is a good sign. The S&P500 Index however is also trading near new highs, which makes the performance in line with the market.
- In the last month FTNT has a been trading in the 73.29 - 78.18 range, which is quite wide. It is currently trading near the high of this range.
- Prices have been consolidating recently, this may present a good entry opportunity.
Our latest full technical report of FTNT contains the most current technical analsysis.
Looking at the Setup
ChartMill incorporates a Setup Rating in its analysis, which measures the extent of consolidation in a stock over recent days and weeks. This rating, ranging from 0 to 10, is updated daily and takes into account multiple short-term technical indicators. The current setup rating for NASDAQ:FTNT is 9:
FTNT has an excellent technical rating and also presents a decent setup pattern. Prices have been consolidating lately. There is a resistance zone just above the current price starting at 77.22. Right above this resistance zone may be a good entry point. There is a support zone below the current price at 76.28, a Stop Loss order could be placed below this zone. Very recently a Pocket Pivot signal was observed. This is another positive sign.
How to trade NASDAQ:FTNT?
One strategy to consider is waiting for the actual breakout to occur, where the stock breaks out above the current consolidation zone. Traders can then enter a buy position, anticipating further upward momentum. As a risk management measure, it is advisable to set a stop loss order below the consolidation zone.
Important Note: The content of this article is not intended as trading advice. It is essential to perform your own analysis and exercise caution when making trading decisions. The article presents technical observations generated by automated analysis but does not guarantee any trading outcomes. Always trade responsibly and make independent judgments.
More breakout setups can be found in our Breakout screener.
Keep in mind
Important Note: The content of this article is not intended as trading advice. It is essential to perform your own analysis and exercise caution when making trading decisions. The article presents observations created by automated analysis but does not guarantee any trading or investment outcomes. Always trade responsibly and make independent judgments.
NASDAQ:FTNT (2/19/2025, 3:14:06 PM)
114.3
+0.04 (+0.04%)
Find more stocks in the Stock Screener
FTNT Latest News and Analysis
 5 days ago - ChartmillWhy FORTINET INC (NASDAQ:FTNT) Deserves Consideration as a Quality Investment.
A fundamental analysis of (NASDAQ:FTNT): This article explores why quality investors may have a look at FORTINET INC (NASDAQ:FTNT)
 12 days ago - ChartmillGet insights into the top movers in the S&P500 index of Friday's pre-market session.
Stay updated with the S&P500 stocks that are on the move in today's pre-market session.
 13 days ago - ChartmillThese stocks are moving in today's after hours session
Let's have a look at what is happening on the US markets after the closing bell on Thursday. Below you can find the top gainers and losers in today's after hours session.
 20 days ago - ChartmillNASDAQ:FTNT is showing good growth, while it is not too expensive.
Uncover the potential of FORTINET INC, a growth stock reasonably priced. NASDAQ:FTNT is excelling in growth aspects, maintaining a healthy financial position, and still offers an attractive valuation.
