NASDAQ:FOXA is a prime example of a stock that offers more than what meets the eye in terms of fundamentals.
By Mill Chart
Last update: Feb 7, 2025
Discover FOX CORP - CLASS A (NASDAQ:FOXA)—an undervalued stock our stock screener has picked out. NASDAQ:FOXA demonstrates solid fundamentals, including health and profitability, all while staying attractively priced. Let's explore the details.
Understanding NASDAQ:FOXA's Valuation Score
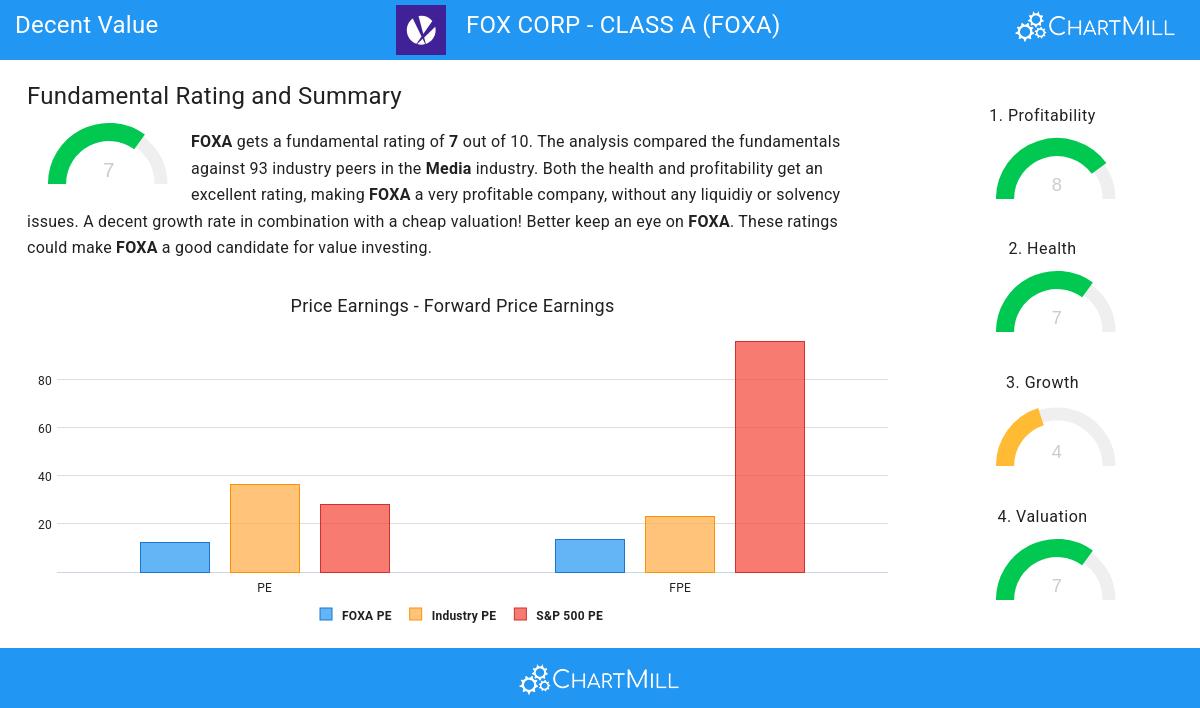
ChartMill assigns a Valuation Rating to each stock, ranging from 0 to 10. This rating is calculated by analyzing different valuation elements, such as price to earnings and free cash flow, both in absolute terms and relative to the market and industry. In the case of NASDAQ:FOXA, the assigned 7 reflects its valuation:
- Based on the Price/Earnings ratio, FOXA is valued a bit cheaper than the industry average as 72.41% of the companies are valued more expensively.
- FOXA's Price/Earnings ratio indicates a rather cheap valuation when compared to the S&P500 average which is at 28.28.
- Based on the Price/Forward Earnings ratio, FOXA is valued a bit cheaper than 71.26% of the companies in the same industry.
- When comparing the Price/Forward Earnings ratio of FOXA to the average of the S&P500 Index (96.20), we can say FOXA is valued rather cheaply.
- Compared to the rest of the industry, the Enterprise Value to EBITDA ratio of FOXA indicates a somewhat cheap valuation: FOXA is cheaper than 60.92% of the companies listed in the same industry.
- 64.37% of the companies in the same industry are more expensive than FOXA, based on the Price/Free Cash Flow ratio.
- The low PEG Ratio(NY), which compensates the Price/Earnings for growth, indicates a rather cheap valuation of the company.
- FOXA has an outstanding profitability rating, which may justify a higher PE ratio.
A Closer Look at Profitability for NASDAQ:FOXA
ChartMill's Profitability Rating offers a unique perspective on stock analysis, providing scores from 0 to 10. These ratings consider a wide range of profitability metrics and margins, both in comparison to industry peers and on their own merits. For NASDAQ:FOXA, the assigned 8 is a significant indicator of profitability:
- FOXA has a better Return On Assets (9.49%) than 90.80% of its industry peers.
- The Return On Equity of FOXA (19.01%) is better than 88.51% of its industry peers.
- With an excellent Return On Invested Capital value of 11.45%, FOXA belongs to the best of the industry, outperforming 89.66% of the companies in the same industry.
- The Average Return On Invested Capital over the past 3 years for FOXA is above the industry average of 6.98%.
- The last Return On Invested Capital (11.45%) for FOXA is above the 3 year average (10.04%), which is a sign of increasing profitability.
- FOXA's Profit Margin of 14.39% is amongst the best of the industry. FOXA outperforms 90.80% of its industry peers.
- With an excellent Operating Margin value of 20.37%, FOXA belongs to the best of the industry, outperforming 90.80% of the companies in the same industry.
Understanding NASDAQ:FOXA's Health Score
ChartMill employs a unique Health Rating system for all stocks. This rating, ranging from 0 to 10, is determined by analyzing various liquidity and solvency ratios. For NASDAQ:FOXA, the assigned 7 for health provides valuable insights:
- FOXA has a better Altman-Z score (2.87) than 83.91% of its industry peers.
- The Debt to FCF ratio of FOXA is 3.92, which is a good value as it means it would take FOXA, 3.92 years of fcf income to pay off all of its debts.
- FOXA has a Debt to FCF ratio of 3.92. This is in the better half of the industry: FOXA outperforms 78.16% of its industry peers.
- FOXA has a Current Ratio of 2.50. This indicates that FOXA is financially healthy and has no problem in meeting its short term obligations.
- With a decent Current ratio value of 2.50, FOXA is doing good in the industry, outperforming 74.71% of the companies in the same industry.
- FOXA has a Quick Ratio of 2.14. This indicates that FOXA is financially healthy and has no problem in meeting its short term obligations.
- FOXA has a better Quick ratio (2.14) than 68.97% of its industry peers.
Growth Assessment of NASDAQ:FOXA
A key component of ChartMill's stock assessment is the Growth Rating, which spans from 0 to 10. This rating evaluates diverse growth factors, such as EPS and revenue growth, considering both past performance and future projections. NASDAQ:FOXA has received a 4 out of 10:
- FOXA shows a strong growth in Earnings Per Share. In the last year, the EPS has been growing by 35.38%, which is quite impressive.
- The Earnings Per Share has been growing by 8.16% on average over the past years. This is quite good.
More Decent Value stocks can be found in our Decent Value screener.
Our latest full fundamental report of FOXA contains the most current fundamental analsysis.
Disclaimer
This article should in no way be interpreted as advice. The article is based on the observed metrics at the time of writing, but you should always make your own analysis and trade or invest at your own responsibility.
FOX CORP - CLASS A
NASDAQ:FOXA (2/10/2025, 8:00:59 PM)
After market: 53.25 0 (0%)53.25
+0.46 (+0.87%)
FOXA Latest News and Analysis
 4 days ago - ChartmillNASDAQ:FOXA is a prime example of a stock that offers more than what meets the eye in terms of fundamentals.
Discover FOX CORP - CLASS A, an undervalued stock. NASDAQ:FOXA showcases solid financial health and profitability while maintaining an appealing valuation.
 7 days ago - ChartmillUncover the latest developments among S&P500 stocks in today's session.
Let's have a look at the top S&P500 gainers and losers one hour before the close of the markets of today's session.
7 days ago - ChartmillDiscover which S&P500 stocks are making waves on Tuesday.Join us in exploring the top gainers and losers within the S&P500 index in the middle of the day on Tuesday as we examine the latest happenings in today's session.
 7 days ago - ChartmillGet insights into the top movers in the S&P500 index of Tuesday's pre-market session.
Stay updated with the S&P500 stocks that are on the move in today's pre-market session.
