
NASDAQ:ETSY is not too expensive for the growth it is showing.
By Mill Chart
Last update: Oct 11, 2024
Here's ETSY INC (NASDAQ:ETSY) for you, a growth stock our stock screener believes is undervalued. NASDAQ:ETSY is scoring impressively in terms of growth while demonstrating strong financials. On top of that, it remains attractively priced. Let's break it down further.
Deciphering NASDAQ:ETSY's Growth Rating
ChartMill assigns a Growth Rating to each stock, ranging from 0 to 10. This rating is determined by analyzing different growth elements, including EPS and revenue growth, spanning both historical and future figures. In the case of NASDAQ:ETSY, the assigned 7 reflects its growth potential:
- ETSY shows a strong growth in Earnings Per Share. In the last year, the EPS has been growing by 136.90%, which is quite impressive.
- Measured over the past years, ETSY shows a very strong growth in Earnings Per Share. The EPS has been growing by 30.26% on average per year.
- The Revenue has been growing by 35.41% on average over the past years. This is a very strong growth!
- ETSY is expected to show a strong growth in Earnings Per Share. In the coming years, the EPS will grow by 31.85% yearly.
Unpacking NASDAQ:ETSY's Valuation Rating
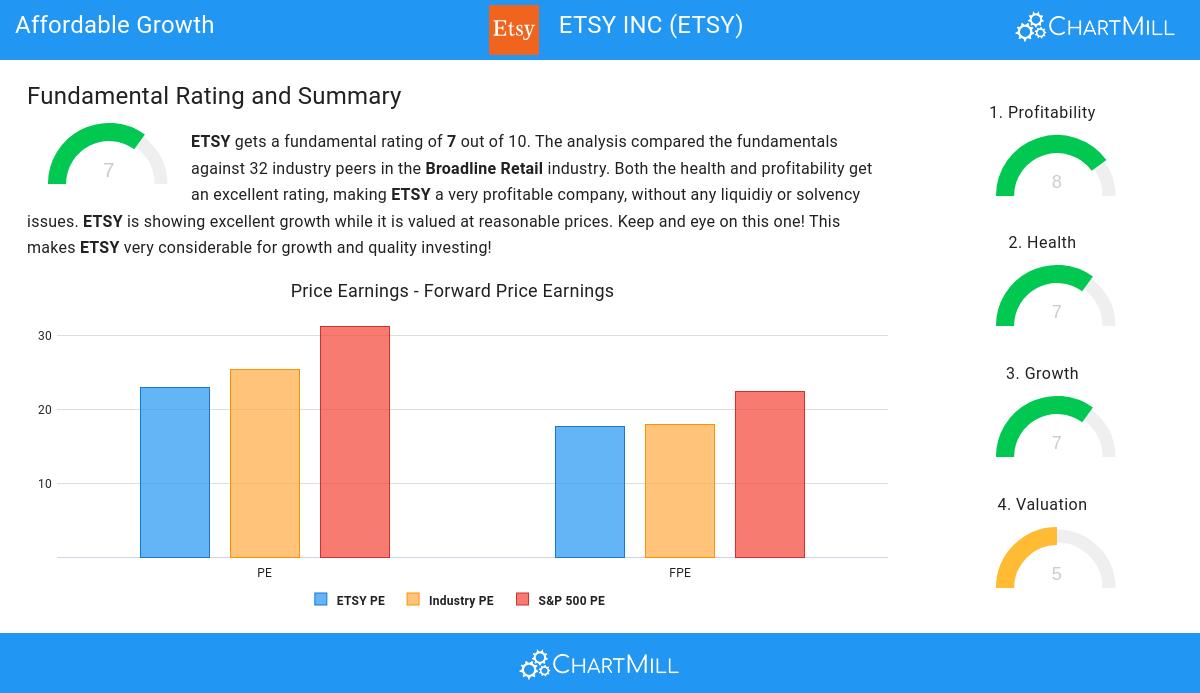
ChartMill assigns a Valuation Rating to each stock, ranging from 0 to 10. This rating is calculated by analyzing different valuation elements, such as price to earnings and free cash flow, both in absolute terms and relative to the market and industry. In the case of NASDAQ:ETSY, the assigned 5 reflects its valuation:
- Compared to an average S&P500 Price/Earnings ratio of 31.21, ETSY is valued a bit cheaper.
- ETSY is valuated rather cheaply when we compare the Price/Forward Earnings ratio to 22.33, which is the current average of the S&P500 Index.
- Based on the Price/Free Cash Flow ratio, ETSY is valued cheaper than 81.25% of the companies in the same industry.
- ETSY has an outstanding profitability rating, which may justify a higher PE ratio.
- A more expensive valuation may be justified as ETSY's earnings are expected to grow with 14.60% in the coming years.
What does the Health looks like for NASDAQ:ETSY
ChartMill assigns a proprietary Health Rating to each stock. The score is computed by evaluating various liquidity and solvency ratios and ranges from 0 to 10. NASDAQ:ETSY was assigned a score of 7 for health:
- ETSY has a debt to FCF ratio of 3.46. This is a good value and a sign of high solvency as ETSY would need 3.46 years to pay back of all of its debts.
- ETSY has a better Debt to FCF ratio (3.46) than 62.50% of its industry peers.
- A Current Ratio of 2.41 indicates that ETSY has no problem at all paying its short term obligations.
- ETSY has a Current ratio of 2.41. This is amongst the best in the industry. ETSY outperforms 84.38% of its industry peers.
- ETSY has a Quick Ratio of 2.41. This indicates that ETSY is financially healthy and has no problem in meeting its short term obligations.
- The Quick ratio of ETSY (2.41) is better than 90.63% of its industry peers.
Profitability Analysis for NASDAQ:ETSY
ChartMill employs its own Profitability Rating system for stock evaluation. This score, ranging from 0 to 10, is derived from an analysis of diverse profitability metrics and margins. In the case of NASDAQ:ETSY, the assigned 8 is noteworthy for profitability:
- With an excellent Return On Assets value of 11.73%, ETSY belongs to the best of the industry, outperforming 87.50% of the companies in the same industry.
- ETSY has a Return On Invested Capital of 15.47%. This is amongst the best in the industry. ETSY outperforms 81.25% of its industry peers.
- Measured over the past 3 years, the Average Return On Invested Capital for ETSY is above the industry average of 11.61%.
- The last Return On Invested Capital (15.47%) for ETSY is above the 3 year average (13.89%), which is a sign of increasing profitability.
- ETSY's Profit Margin of 10.36% is amongst the best of the industry. ETSY outperforms 90.63% of its industry peers.
- ETSY has a Operating Margin of 13.31%. This is amongst the best in the industry. ETSY outperforms 90.63% of its industry peers.
- In the last couple of years the Operating Margin of ETSY has grown nicely.
- ETSY has a better Gross Margin (70.78%) than 87.50% of its industry peers.
Every day, new Affordable Growth stocks can be found on ChartMill in our Affordable Growth screener.
Our latest full fundamental report of ETSY contains the most current fundamental analsysis.
Keep in mind
Important Note: The content of this article is not intended as trading advice. It is essential to perform your own analysis and exercise caution when making trading decisions. The article presents observations created by automated analysis but does not guarantee any trading or investment outcomes. Always trade responsibly and make independent judgments.
53.86
+0.37 (+0.69%)
Find more stocks in the Stock Screener
ETSY Latest News and Analysis

