Investors should take notice of ESSENT GROUP LTD (NYSE:ESNT)—it offers a great deal for the fundamentals it presents.
By Mill Chart
Last update: Apr 29, 2025
ESSENT GROUP LTD (NYSE:ESNT) has caught the attention of our stock screener as a great value stock. ESNT excels in profitability, solvency, and liquidity, all while being very reasonably priced. Let's delve into the details.
Valuation Analysis for ESNT
An integral part of ChartMill's stock analysis is the Valuation Rating, which spans from 0 to 10. This rating evaluates diverse valuation factors, including price to earnings and cash flows, while considering the stock's profitability and growth. ESNT has received a 7 out of 10:
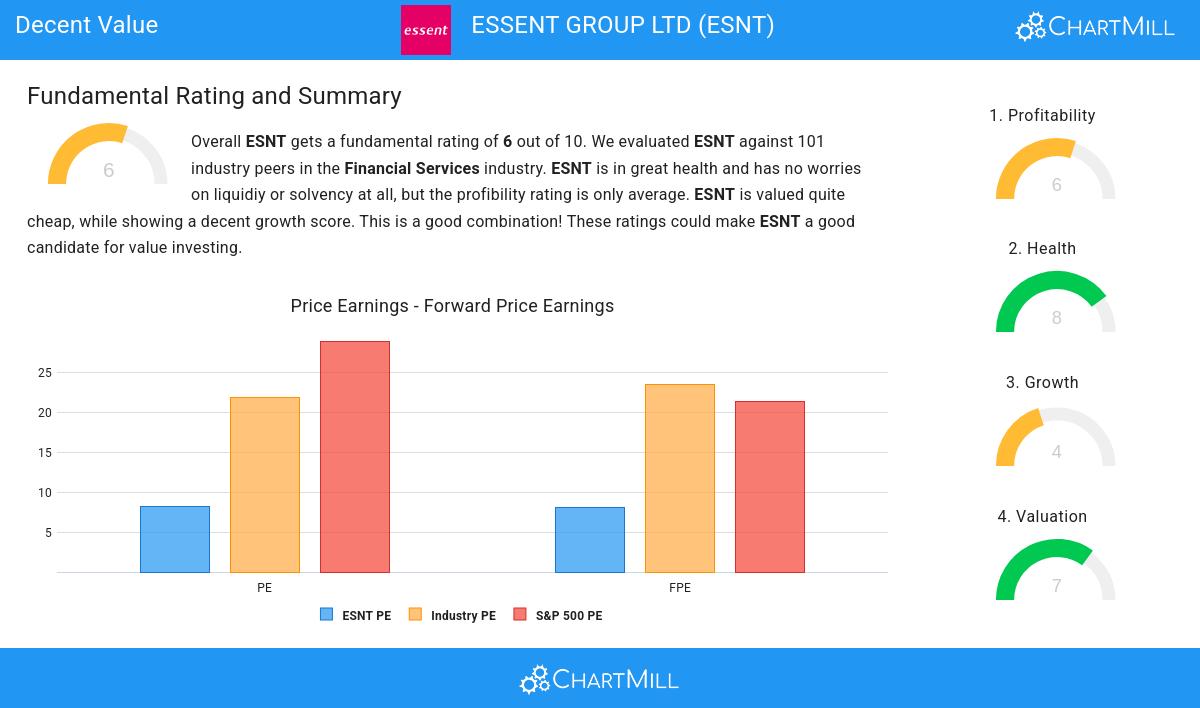
- The Price/Earnings ratio is 8.18, which indicates a very decent valuation of ESNT.
- ESNT's Price/Earnings ratio is a bit cheaper when compared to the industry. ESNT is cheaper than 78.22% of the companies in the same industry.
- ESNT is valuated cheaply when we compare the Price/Earnings ratio to 28.87, which is the current average of the S&P500 Index.
- Based on the Price/Forward Earnings ratio of 8.06, the valuation of ESNT can be described as reasonable.
- Based on the Price/Forward Earnings ratio, ESNT is valued a bit cheaper than 67.33% of the companies in the same industry.
- When comparing the Price/Forward Earnings ratio of ESNT to the average of the S&P500 Index (21.38), we can say ESNT is valued rather cheaply.
- 83.17% of the companies in the same industry are more expensive than ESNT, based on the Enterprise Value to EBITDA ratio.
- ESNT's Price/Free Cash Flow ratio is rather cheap when compared to the industry. ESNT is cheaper than 85.15% of the companies in the same industry.
- The decent profitability rating of ESNT may justify a higher PE ratio.
Analyzing Profitability Metrics
ChartMill's Profitability Rating offers a unique perspective on stock analysis, providing scores from 0 to 10. These ratings consider a wide range of profitability metrics and margins, both in comparison to industry peers and on their own merits. For ESNT, the assigned 6 is a significant indicator of profitability:
- ESNT has a Return On Assets of 10.26%. This is amongst the best in the industry. ESNT outperforms 89.11% of its industry peers.
- ESNT has a better Return On Equity (13.02%) than 61.39% of its industry peers.
- ESNT has a better Return On Invested Capital (10.91%) than 84.16% of its industry peers.
- ESNT's Profit Margin of 58.69% is amongst the best of the industry. ESNT outperforms 96.04% of its industry peers.
- ESNT has a Operating Margin of 71.67%. This is amongst the best in the industry. ESNT outperforms 94.06% of its industry peers.
Health Analysis for ESNT
A critical element of ChartMill's stock evaluation is the Health Rating, which spans from 0 to 10. This rating considers multiple health factors, including liquidity and solvency, both in absolute terms and relative to industry peers. ESNT has received a 8 out of 10:
- An Altman-Z score of 3.87 indicates that ESNT is not in any danger for bankruptcy at the moment.
- ESNT has a better Altman-Z score (3.87) than 89.11% of its industry peers.
- ESNT has a debt to FCF ratio of 0.58. This is a very positive value and a sign of high solvency as it would only need 0.58 years to pay back of all of its debts.
- With an excellent Debt to FCF ratio value of 0.58, ESNT belongs to the best of the industry, outperforming 86.14% of the companies in the same industry.
- A Debt/Equity ratio of 0.09 indicates that ESNT is not too dependend on debt financing.
- ESNT has a better Debt to Equity ratio (0.09) than 82.18% of its industry peers.
- ESNT has a Current Ratio of 2.77. This indicates that ESNT is financially healthy and has no problem in meeting its short term obligations.
- ESNT's Current ratio of 2.77 is amongst the best of the industry. ESNT outperforms 86.14% of its industry peers.
- A Quick Ratio of 2.77 indicates that ESNT has no problem at all paying its short term obligations.
- ESNT has a better Quick ratio (2.77) than 87.13% of its industry peers.
Growth Assessment of ESNT
ChartMill assigns a Growth Rating to every stock. This score ranges from 0 to 10 and evaluates the different growth aspects like EPS and Revenue, both in the past as in the future. ESNT scores a 4 out of 10:
- The Revenue has grown by 12.01% in the past year. This is quite good.
Every day, new Decent Value stocks can be found on ChartMill in our Decent Value screener.
Check the latest full fundamental report of ESNT for a complete fundamental analysis.
Keep in mind
This is not investing advice! The article highlights some of the observations at the time of writing, but you should always make your own analysis and invest based on your own insights.
55.95
+0.41 (+0.74%)
Find more stocks in the Stock Screener
ESNT Latest News and Analysis
 2 minutes ago - ChartmillInvestors should take notice of ESSENT GROUP LTD (NYSE:ESNT)—it offers a great deal for the fundamentals it presents.
ESSENT GROUP LTD has a stellar value proposition. NYSE:ESNT not only scores well in profitability, solvency, and liquidity but also maintains a very reasonable price point.
