
For growth-minded investors, high revenue and EPS growth are key criteria. Today, we'll examine whether DEXCOM INC (NASDAQ:DXCM) fits the bill for growth investing, particularly as it forms a base and hints at a potential breakout. Remember, due diligence is essential, but DEXCOM INC has caught our attention on our screen for growth with base formation. It may warrant additional investigation.
How We Gauge Growth for NASDAQ:DXCM
ChartMill assigns a Growth Rating to every stock. This score ranges from 0 to 10 and evaluates the different growth aspects like EPS and Revenue, both in the past as in the future. NASDAQ:DXCM scores a 9 out of 10:
- The Earnings Per Share has grown by an impressive 54.87% over the past year.
- The Earnings Per Share has been growing by 83.54% on average over the past years. This is a very strong growth
- Looking at the last year, DXCM shows a very strong growth in Revenue. The Revenue has grown by 23.05%.
- DXCM shows a strong growth in Revenue. Measured over the last years, the Revenue has been growing by 28.56% yearly.
- DXCM is expected to show a strong growth in Earnings Per Share. In the coming years, the EPS will grow by 21.67% yearly.
- DXCM is expected to show quite a strong growth in Revenue. In the coming years, the Revenue will grow by 17.04% yearly.
A Closer Look at Health for NASDAQ:DXCM
Every stock is evaluated by ChartMill, receiving a Health Rating on a scale of 0 to 10. This assessment considers different health aspects, including liquidity and solvency, both in absolute terms and relative to industry peers. NASDAQ:DXCM has achieved a 6 out of 10:
- An Altman-Z score of 5.57 indicates that DXCM is not in any danger for bankruptcy at the moment.
- DXCM has a better Altman-Z score (5.57) than 79.14% of its industry peers.
- DXCM has a debt to FCF ratio of 3.75. This is a good value and a sign of high solvency as DXCM would need 3.75 years to pay back of all of its debts.
- Looking at the Debt to FCF ratio, with a value of 3.75, DXCM belongs to the top of the industry, outperforming 85.56% of the companies in the same industry.
- A Current Ratio of 2.82 indicates that DXCM has no problem at all paying its short term obligations.
- DXCM has a Quick Ratio of 2.48. This indicates that DXCM is financially healthy and has no problem in meeting its short term obligations.
How do we evaluate the Profitability for NASDAQ:DXCM?
ChartMill utilizes a Profitability Rating to assess stocks, scoring them on a scale of 0 to 10. This rating takes into account a variety of profitability ratios and margins, both in absolute terms and in comparison to industry peers. NASDAQ:DXCM has earned a 8 out of 10:
- DXCM has a better Return On Assets (9.81%) than 91.44% of its industry peers.
- DXCM has a Return On Equity of 27.40%. This is amongst the best in the industry. DXCM outperforms 96.79% of its industry peers.
- Looking at the Return On Invested Capital, with a value of 11.24%, DXCM belongs to the top of the industry, outperforming 92.51% of the companies in the same industry.
- The 3 year average ROIC (8.57%) for DXCM is below the current ROIC(11.24%), indicating increased profibility in the last year.
- With an excellent Profit Margin value of 16.95%, DXCM belongs to the best of the industry, outperforming 92.51% of the companies in the same industry.
- DXCM's Operating Margin of 17.74% is amongst the best of the industry. DXCM outperforms 89.84% of its industry peers.
- DXCM has a better Gross Margin (63.16%) than 63.64% of its industry peers.
How does the Setup look for NASDAQ:DXCM
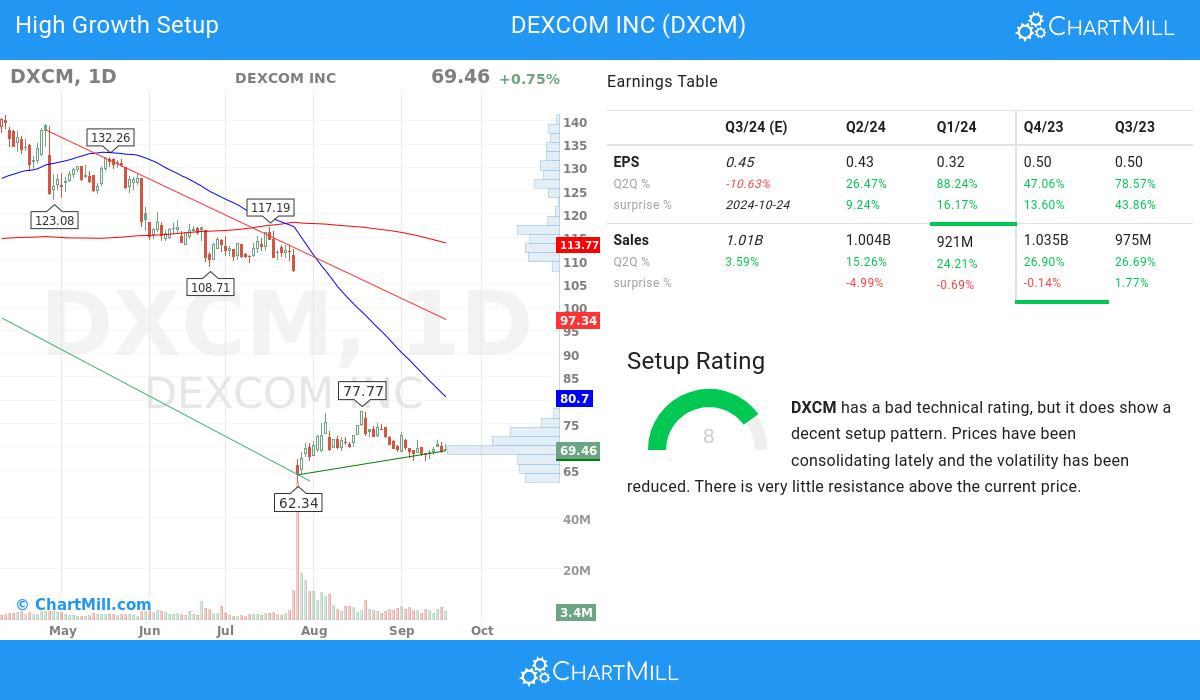
Besides the Technical Rating, ChartMill also assign a Setup Rating to every stock. This setup score also ranges from 0 to 10 and determines to which extend the stock is consolidating. This is achieved by evaluating multiple short term technical indicators. NASDAQ:DXCM currently has a 8 as setup rating:
DXCM has a bad technical rating, but it does show a decent setup pattern. Prices have been consolidating lately and the volatility has been reduced. There is very little resistance above the current price.
More Strong Growth stocks can be found in our Strong Growth screener.
For an up to date full fundamental analysis you can check the fundamental report of DXCM
For an up to date full technical analysis you can check the technical report of DXCM
Keep in mind
This article should in no way be interpreted as advice. The article is based on the observed metrics at the time of writing, but you should always make your own analysis and trade or invest at your own responsibility.
