For those who appreciate growth without the sticker shock, NASDAQ:DRS is worth considering.
By Mill Chart
Last update: Feb 14, 2025
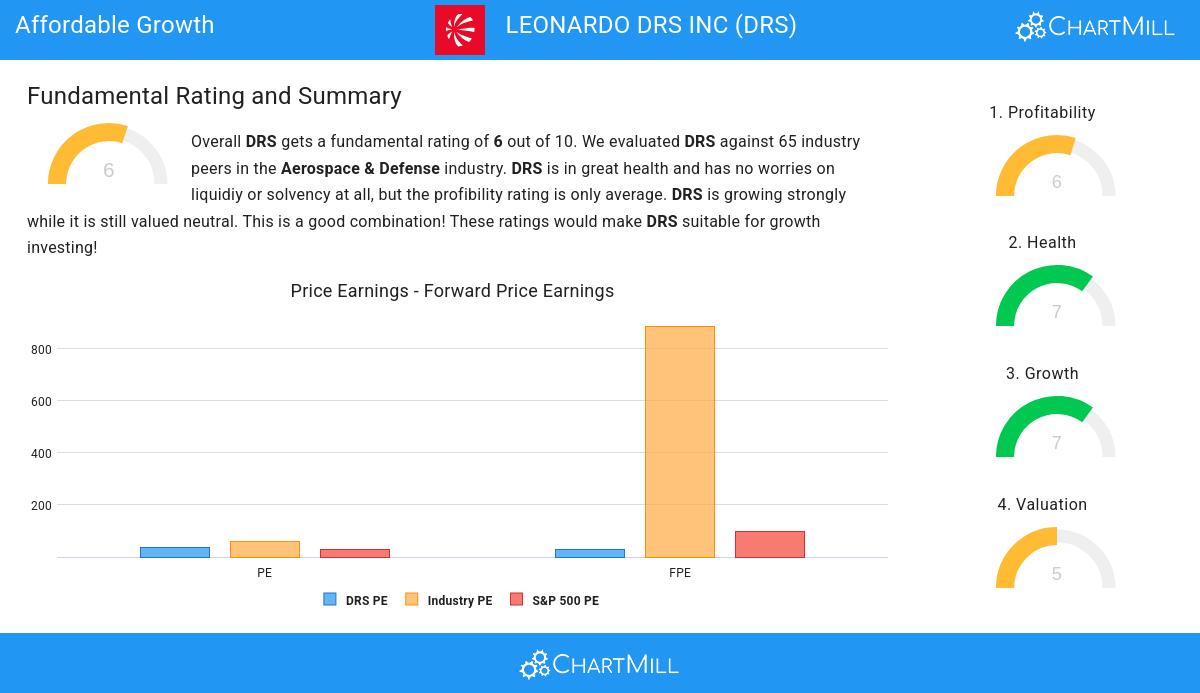
Our stock screener has spotted LEONARDO DRS INC (NASDAQ:DRS) as a growth stock which is not overvalued. NASDAQ:DRS is scoring great on several growth aspects while it also shows decent health and profitability. At the same time it remains remains attractively priced. We'll dive into each aspect below.
Evaluating Growth: NASDAQ:DRS
Every stock receives a Growth Rating from ChartMill, ranging from 0 to 10. This rating assesses various growth aspects, including historical and projected EPS and revenue growth. NASDAQ:DRS boasts a 7 out of 10:
- The Earnings Per Share has grown by an nice 12.99% over the past year.
- DRS shows a strong growth in Earnings Per Share. Measured over the last years, the EPS has been growing by 99.77% yearly.
- DRS shows quite a strong growth in Revenue. In the last year, the Revenue has grown by 16.88%.
- Measured over the past years, DRS shows a very strong growth in Revenue. The Revenue has been growing by 151.65% on average per year.
- DRS is expected to show quite a strong growth in Earnings Per Share. In the coming years, the EPS will grow by 18.41% yearly.
- The Revenue is expected to grow by 9.68% on average over the next years. This is quite good.
Understanding NASDAQ:DRS's Valuation Score
ChartMill employs its own Valuation Rating system for all stocks. This score, ranging from 0 to 10, is determined by evaluating different valuation factors, including price to earnings and free cash flow, both in absolute terms and relative to the market and industry. NASDAQ:DRS has earned a 5 for valuation:
- DRS's Price/Earnings ratio is a bit cheaper when compared to the industry. DRS is cheaper than 64.06% of the companies in the same industry.
- Based on the Price/Forward Earnings ratio, DRS is valued a bit cheaper than 62.50% of the companies in the same industry.
- The average S&P500 Price/Forward Earnings ratio is at 96.73. DRS is valued rather cheaply when compared to this.
- DRS's Price/Free Cash Flow ratio is rather cheap when compared to the industry. DRS is cheaper than 81.25% of the companies in the same industry.
- The decent profitability rating of DRS may justify a higher PE ratio.
- A more expensive valuation may be justified as DRS's earnings are expected to grow with 18.41% in the coming years.
Health Insights: NASDAQ:DRS
Every stock is evaluated by ChartMill, receiving a Health Rating on a scale of 0 to 10. This assessment considers different health aspects, including liquidity and solvency, both in absolute terms and relative to industry peers. NASDAQ:DRS has achieved a 7 out of 10:
- DRS has an Altman-Z score of 4.08. This indicates that DRS is financially healthy and has little risk of bankruptcy at the moment.
- The Altman-Z score of DRS (4.08) is better than 60.94% of its industry peers.
- The Debt to FCF ratio of DRS is 1.36, which is an excellent value as it means it would take DRS, only 1.36 years of fcf income to pay off all of its debts.
- DRS has a Debt to FCF ratio of 1.36. This is amongst the best in the industry. DRS outperforms 93.75% of its industry peers.
- A Debt/Equity ratio of 0.14 indicates that DRS is not too dependend on debt financing.
- With a decent Debt to Equity ratio value of 0.14, DRS is doing good in the industry, outperforming 79.69% of the companies in the same industry.
- DRS has a Current Ratio of 2.11. This indicates that DRS is financially healthy and has no problem in meeting its short term obligations.
- DRS has a Quick ratio of 1.70. This is in the better half of the industry: DRS outperforms 68.75% of its industry peers.
How do we evaluate the Profitability for NASDAQ:DRS?
ChartMill assigns a Profitability Rating to every stock. This score ranges from 0 to 10 and evaluates the different profitability ratios and margins, both absolutely, but also relative to the industry peers. NASDAQ:DRS scores a 6 out of 10:
- Looking at the Return On Assets, with a value of 5.13%, DRS is in the better half of the industry, outperforming 64.06% of the companies in the same industry.
- DRS's Return On Equity of 8.00% is fine compared to the rest of the industry. DRS outperforms 60.94% of its industry peers.
- DRS's Return On Invested Capital of 7.84% is fine compared to the rest of the industry. DRS outperforms 68.75% of its industry peers.
- The Average Return On Invested Capital over the past 3 years for DRS is significantly above the industry average of 7.90%.
- The 3 year average ROIC (15.17%) for DRS is well above the current ROIC(7.84%). The reason for the recent decline needs to be investigated.
- DRS has a better Profit Margin (6.23%) than 60.94% of its industry peers.
- DRS's Profit Margin has improved in the last couple of years.
- DRS's Operating Margin has improved in the last couple of years.
More Affordable Growth stocks can be found in our Affordable Growth screener.
For an up to date full fundamental analysis you can check the fundamental report of DRS
Disclaimer
This article should in no way be interpreted as advice. The article is based on the observed metrics at the time of writing, but you should always make your own analysis and trade or invest at your own responsibility.
NASDAQ:DRS (2/19/2025, 3:08:00 PM)
29.495
+0.11 (+0.36%)
Find more stocks in the Stock Screener
DRS Latest News and Analysis
 5 days ago - ChartmillFor those who appreciate growth without the sticker shock, NASDAQ:DRS is worth considering.
LEONARDO DRS INC was identified as a growth stock that isn't overvalued. NASDAQ:DRS is excelling in various growth indicators while maintaining a solid financial footing.
