Exploring the Growth Potential of CLEARWATER ANALYTICS HDS-A (NYSE:CWAN) as It Nears a Breakout.
By Mill Chart
Last update: Feb 28, 2025
In this article, we'll take a closer look at CLEARWATER ANALYTICS HDS-A (NYSE:CWAN) as a potential candidate for growth investing. While it's important for investors to conduct their own research, CLEARWATER ANALYTICS HDS-A has piqued our interest by appearing on our strong growth and breakout radar. Let's explore further.
Assessing Growth Metrics for NYSE:CWAN
ChartMill employs its own Growth Rating system for all stocks. This score, ranging from 0 to 10, is derived by evaluating different growth factors, such as EPS and revenue growth, taking into account both past performance and future projections. NYSE:CWAN has earned a 9 for growth:
- The Earnings Per Share has grown by an impressive 32.35% over the past year.
- Measured over the past years, CWAN shows a very strong growth in Earnings Per Share. The EPS has been growing by 110.89% on average per year.
- Looking at the last year, CWAN shows a very strong growth in Revenue. The Revenue has grown by 22.72%.
- The Revenue has been growing by 21.88% on average over the past years. This is a very strong growth!
- The Earnings Per Share is expected to grow by 24.92% on average over the next years. This is a very strong growth
- CWAN is expected to show quite a strong growth in Revenue. In the coming years, the Revenue will grow by 18.99% yearly.
Health Insights: NYSE:CWAN
ChartMill employs its own Health Rating for stock assessment. This rating, ranging from 0 to 10, is calculated by examining various liquidity and solvency ratios. In the case of NYSE:CWAN, the assigned 7 reflects its health status:
- CWAN has an Altman-Z score of 21.21. This indicates that CWAN is financially healthy and has little risk of bankruptcy at the moment.
- CWAN has a better Altman-Z score (21.21) than 94.55% of its industry peers.
- The Debt to FCF ratio of CWAN is 0.38, which is an excellent value as it means it would take CWAN, only 0.38 years of fcf income to pay off all of its debts.
- The Debt to FCF ratio of CWAN (0.38) is better than 76.73% of its industry peers.
- A Debt/Equity ratio of 0.11 indicates that CWAN is not too dependend on debt financing.
- A Current Ratio of 4.66 indicates that CWAN has no problem at all paying its short term obligations.
- CWAN's Current ratio of 4.66 is amongst the best of the industry. CWAN outperforms 86.18% of its industry peers.
- A Quick Ratio of 4.66 indicates that CWAN has no problem at all paying its short term obligations.
- CWAN has a Quick ratio of 4.66. This is amongst the best in the industry. CWAN outperforms 86.18% of its industry peers.
Analyzing Profitability Metrics
ChartMill assigns a Profitability Rating to every stock. This score ranges from 0 to 10 and evaluates the different profitability ratios and margins, both absolutely, but also relative to the industry peers. NYSE:CWAN scores a 5 out of 10:
- CWAN has a better Return On Assets (0.11%) than 61.09% of its industry peers.
- With a decent Return On Equity value of 0.16%, CWAN is doing good in the industry, outperforming 62.55% of the companies in the same industry.
- CWAN has a better Return On Invested Capital (2.02%) than 66.91% of its industry peers.
- With a decent Profit Margin value of 0.16%, CWAN is doing good in the industry, outperforming 61.82% of the companies in the same industry.
- CWAN's Profit Margin has improved in the last couple of years.
- With a decent Operating Margin value of 3.21%, CWAN is doing good in the industry, outperforming 67.64% of the companies in the same industry.
Why is NYSE:CWAN a setup?
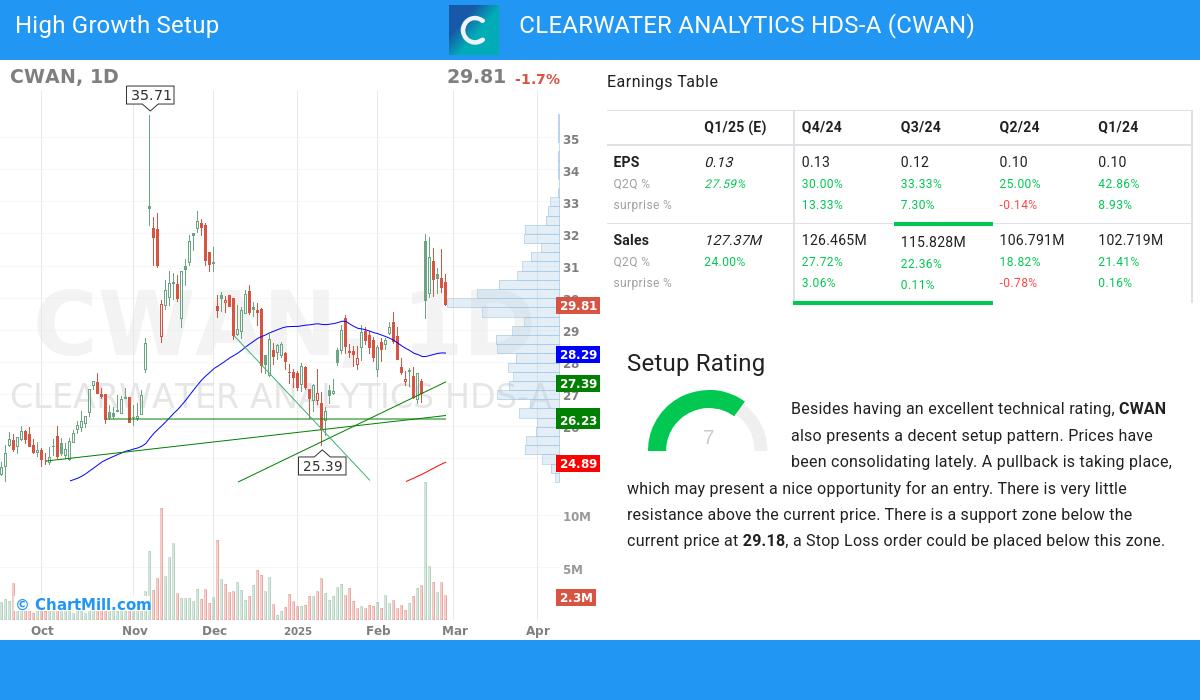
Alongside the Technical Rating, ChartMill assigns a Setup Rating to evaluate the consolidation level of a stock. This rating, ranging from 0 to 10, is updated daily and considers various short-term technical indicators. The current setup rating for NYSE:CWAN is 7:
Besides having an excellent technical rating, CWAN also presents a decent setup pattern. Prices have been consolidating lately. A pullback is taking place, which may present a nice opportunity for an entry. There is very little resistance above the current price. There is a support zone below the current price at 29.18, a Stop Loss order could be placed below this zone.
Our Strong Growth screener lists more Strong Growth stocks and is updated daily.
For an up to date full fundamental analysis you can check the fundamental report of CWAN
Our latest full technical report of CWAN contains the most current technical analsysis.
Disclaimer
This article should in no way be interpreted as advice. The article is based on the observed metrics at the time of writing, but you should always make your own analysis and trade or invest at your own responsibility.
29.81
-0.52 (-1.71%)
Find more stocks in the Stock Screener
CWAN Latest News and Analysis
 2 minutes ago - ChartmillExploring the Growth Potential of CLEARWATER ANALYTICS HDS-A (NYSE:CWAN) as It Nears a Breakout.
Based on a technical and fundamental analysis of NYSE:CWAN we are exploring the Growth Potential of CLEARWATER ANALYTICS HDS-A (NYSE:CWAN) as It Nears a Breakout.
 9 days ago - ChartmillWhich stocks are moving after the closing bell on Wednesday?
As the regular session of the US market concludes on Wednesday, let's get an insight into the after-hours session and identify the stocks leading the pack in terms of gains and losses.
