
Indications Suggest CVS HEALTH CORP (NYSE:CVS) Could Be on the Verge of a Breakout.
By Mill Chart
Last update: Apr 2, 2025
Our stockscreener has identified a possible breakout setup on CVS HEALTH CORP (NYSE:CVS). This occurs when the stock consolidates following a significant upward movement. While the breakout outcome cannot be guaranteed, it may be worth monitoring NYSE:CVS for potential opportunities.
Analyzing the Technical Aspects
ChartMill assigns a Technical Rating to every stock. This score ranges from 0 to 10 and is updated daily. The score is determined by evaluating multiple technical indicators and properties.
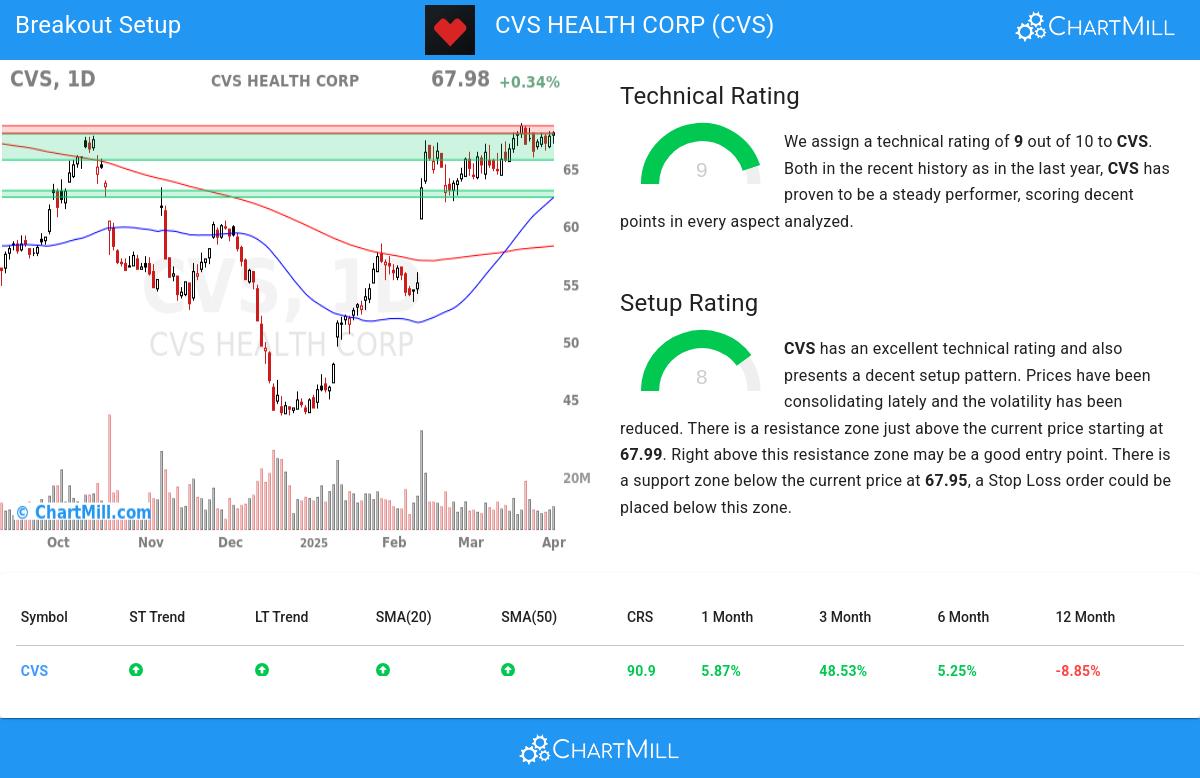
Overall CVS gets a technical rating of 9 out of 10. Both in the recent history as in the last year, CVS has proven to be a steady performer, scoring decent points in every aspect analyzed.
- Both the short term and long term trends are positive. This is a very positive sign.
- CVS is one of the better performing stocks in the Health Care Providers & Services industry, it outperforms 79% of 110 stocks in the same industry.
- CVS is currently trading in the upper part of its 52 week range. The market is still in the middle of its 52 week range, so CVS slightly outperforms the market at the moment.
- In the last month CVS has a been trading in the 64.00 - 68.87 range, which is quite wide. It is currently trading near the high of this range.
- Looking at the yearly performance, CVS did better than 90% of all other stocks. However, this relatively good performance is mostly due to a recent big move.
For an up to date full technical analysis you can check the technical report of CVS
Looking at the Setup
ChartMill incorporates a Setup Rating in its analysis, which measures the extent of consolidation in a stock over recent days and weeks. This rating, ranging from 0 to 10, is updated daily and takes into account multiple short-term technical indicators. The current setup rating for CVS is 8:
CVS has an excellent technical rating and also presents a decent setup pattern. We see reduced volatility while prices have been consolidating in the most recent period. There is a resistance zone just above the current price starting at 67.99. Right above this resistance zone may be a good entry point. There is a support zone below the current price at 67.95, a Stop Loss order could be placed below this zone.
How to trade CVS?
To potentially initiate a trade, it is common practice to wait for the stock to break out of the consolidation zone. This breakout signifies a potential upward movement, and traders may enter the stock at that point. Conversely, if the stock falls back below the consolidation zone, it may be sold at a loss.
Of course, there are many ways to trade or not trade CVS and this article should in no way be interpreted as trading advice. The article is purely based on an automated technical analysis and just points out the technical observations. Always make your own analysis and trade at your own responsibility.
Every day, new breakout setups can be found on ChartMill in our Breakout screener.
Disclaimer
This article should in no way be interpreted as advice. The article is based on the observed metrics at the time of writing, but you should always make your own analysis and trade or invest at your own responsibility.
NYSE:CVS (4/24/2025, 3:07:10 PM)
65.68
+0.11 (+0.17%)
Find more stocks in the Stock Screener
CVS Latest News and Analysis
 7 days ago - ChartmillThese S&P500 stocks are gapping in today's session
Stay tuned for the market movements in the S&P500 index on Thursday. Check out the gap up and gap down stocks in the S&P500 index during today's session.
 7 days ago - ChartmillTop S&P500 movers in Thursday's pre-market session
Let's have a look at what is happening on the US markets before the opening bell on Thursday. Below you can find the top S&P500 gainers and losers in today's pre-market session.
 16 days ago - ChartmillTuesday's session: top gainers and losers in the S&P500 index
Curious about the top performers within the S&P500 index one hour before the close of the markets on Tuesday? Dive into the list of today's session's top gainers and losers for a comprehensive overview.
 16 days ago - ChartmillIn today's session, there are S&P500 stocks with remarkable trading volume.
Let's take a look at the S&P500 stocks that are experiencing unusual volume in today's session.
16 days ago - ChartmillExplore the top gainers and losers within the S&P500 index in today's session.Curious about the top performers within the S&P500 index in the middle of the day on Tuesday? Dive into the list of today's session's top gainers and losers for a comprehensive overview.
16 days ago - ChartmillWhich S&P500 stocks are gapping on Tuesday?Curious about the market action on Tuesday? Dive into the US markets to explore the gap up and gap down stocks in the S&P500 index during today's session.
16 days ago - ChartmillTuesday's pre-market session: top gainers and losers in the S&P500 indexThe US market session of Tuesday has yet to be opened, let's have a look at the top S&P500 gainers and losers in the pre-market session today.
 17 days ago - ChartmillStay updated with the S&P500 stocks that are on the move in today's after-hours session.
Let's have a look at what is happening on the US markets after the closing bell on Monday. Below you can find the top S&P500 gainers and losers in today's after hours session.
