Good technical signals and a possible breakout for CISCO SYSTEMS INC (NASDAQ:CSCO).
By Mill Chart
Last update: Mar 5, 2025
We've identified CISCO SYSTEMS INC (NASDAQ:CSCO) as a potential breakout candidate based on our stock screener's analysis. This breakout setup pattern suggests that after a strong uptrend, the stock is currently consolidating, potentially signaling a continuation of the trend. Keep an eye on NASDAQ:CSCO for further developments.
Technical Analysis Observations
ChartMill assigns a Technical Rating to every stock. This score ranges from 0 to 10 and is updated daily. The score is determined by evaluating multiple technical indicators and properties.
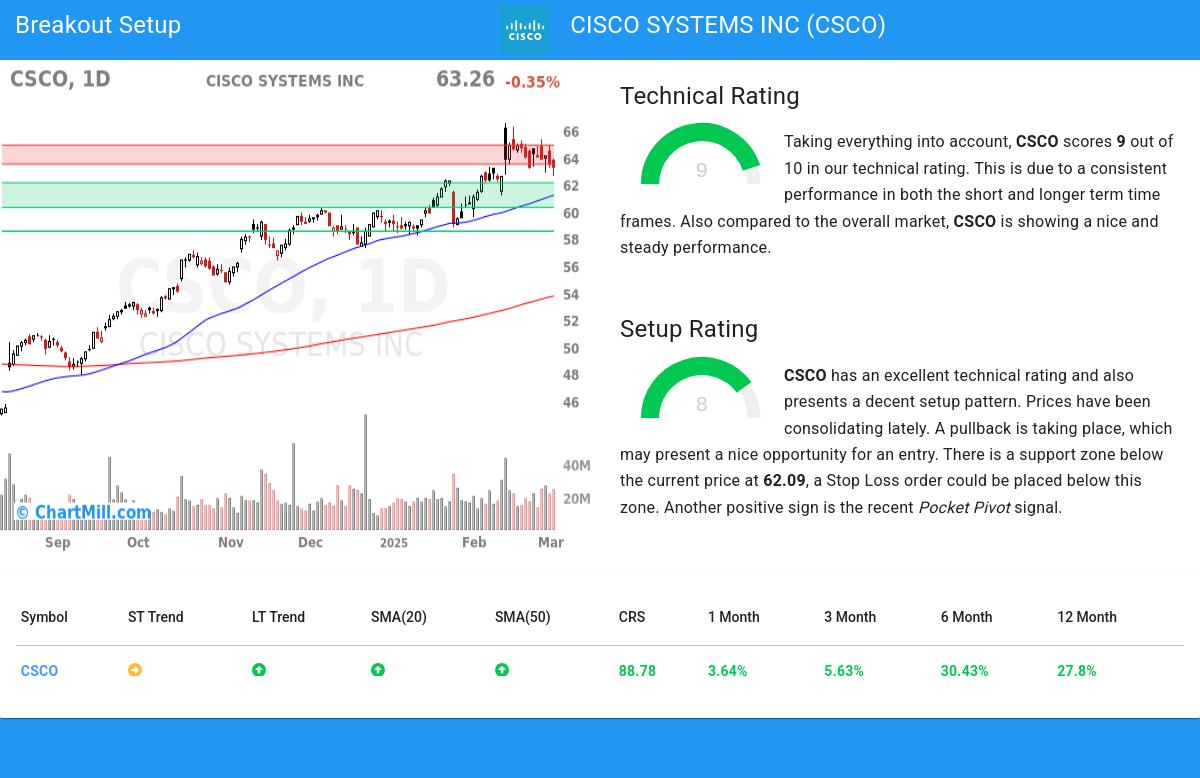
Taking everything into account, CSCO scores 9 out of 10 in our technical rating. Both in the recent history as in the last year, CSCO has proven to be a steady performer, scoring decent points in every aspect analyzed.
- The long term trend is positive and the short term trend is neutral. The long term trend gets the benefit of the doubt for now.
- Looking at the yearly performance, CSCO did better than 88% of all other stocks.
- CSCO is currently trading in the upper part of its 52 week range. The S&P500 Index is also trading in the upper part of its 52 week range, so CSCO is performing more or less in line with the market.
- CSCO is currently showing a bull flag pattern! A bull flag pattern occurs when prices pull back slightly after a strong rise up. This may be a nice opportunity for an entry.
- CSCO is part of the Communications Equipment industry. There are 51 other stocks in this industry, CSCO did better than 64% of them.
For an up to date full technical analysis you can check the technical report of CSCO
Looking at the Setup
Besides the Technical Rating, ChartMill assigns a Setup Rating to every stock to determine the degree of consolidation. This rating, ranging from 0 to 10, is updated daily and evaluates various short-term technical indicators. NASDAQ:CSCO currently holds a 8 as its setup rating, suggesting a particular level of consolidation in the stock.
CSCO has an excellent technical rating and also presents a decent setup pattern. Prices have been consolidating lately. A pullback is taking place, which may present a nice opportunity for an entry. There is a support zone below the current price at 62.09, a Stop Loss order could be placed below this zone. Another positive sign is the recent Pocket Pivot signal.
How to trade NASDAQ:CSCO?
To potentially initiate a trade, it is common practice to wait for the stock to break out of the consolidation zone. This breakout signifies a potential upward movement, and traders may enter the stock at that point. Conversely, if the stock falls back below the consolidation zone, it may be sold at a loss.
Important Note: The content of this article is not intended as trading advice. It is essential to perform your own analysis and exercise caution when making trading decisions. The article presents technical observations generated by automated analysis but does not guarantee any trading outcomes. Always trade responsibly and make independent judgments.
Every day, new breakout setups can be found on ChartMill in our Breakout screener.
Disclaimer
This article should in no way be interpreted as advice. The article is based on the observed metrics at the time of writing, but you should always make your own analysis and trade or invest at your own responsibility.
63.94
+0.53 (+0.84%)
Find more stocks in the Stock Screener
CSCO Latest News and Analysis
 4 days ago - ChartmillGood technical signals and a possible breakout for CISCO SYSTEMS INC (NASDAQ:CSCO).
Interesting Technical Analysis finding for CISCO SYSTEMS INC (NASDAQ:CSCO): Indications Suggest NASDAQ:CSCO Could Be on the Verge of a Breakout.
13 days ago - ChartmillNASDAQ:CSCO may be ready to breakout.CISCO SYSTEMS INC (NASDAQ:CSCO) has a strong technical rating of 10 out of 10, indicating a potential breakout.
