CELESTICA INC (NYSE:CLS)—A High-Growth Stock Gearing Up for Its Next Upward Move.
By Mill Chart
Last update: Apr 23, 2025
In this article we will dive into CELESTICA INC (NYSE:CLS) as a possible candidate for growth investing. Investors should always do their own research, but we noticed CELESTICA INC showing up in our strong growth, ready to breakout screen, which makes it worth to investigate a bit more.
Growth Insights: CLS
ChartMill assigns a Growth Rating to every stock. This score ranges from 0 to 10 and evaluates the different growth aspects like EPS and Revenue, both in the past as in the future. CLS scores a 8 out of 10:
- CLS shows a strong growth in Earnings Per Share. In the last year, the EPS has been growing by 61.32%, which is quite impressive.
- The Earnings Per Share has been growing by 48.11% on average over the past years. This is a very strong growth
- Looking at the last year, CLS shows a very strong growth in Revenue. The Revenue has grown by 21.17%.
- Measured over the past years, CLS shows a quite strong growth in Revenue. The Revenue has been growing by 10.38% on average per year.
- The Earnings Per Share is expected to grow by 24.42% on average over the next years. This is a very strong growth
- Based on estimates for the next years, CLS will show a quite strong growth in Revenue. The Revenue will grow by 13.06% on average per year.
- When comparing the Revenue growth rate of the last years to the growth rate of the upcoming years, we see that the growth is accelerating.
Looking at the Health
To gauge a stock's financial health, ChartMill utilizes a Health Rating on a scale of 0 to 10. This comprehensive evaluation encompasses liquidity and solvency, both in absolute terms and in comparison to industry peers. CLS has earned a 5 out of 10:
- CLS has an Altman-Z score of 3.40. This indicates that CLS is financially healthy and has little risk of bankruptcy at the moment.
- With a decent Altman-Z score value of 3.40, CLS is doing good in the industry, outperforming 62.10% of the companies in the same industry.
- The Debt to FCF ratio of CLS is 3.01, which is a good value as it means it would take CLS, 3.01 years of fcf income to pay off all of its debts.
- CLS's Debt to FCF ratio of 3.01 is fine compared to the rest of the industry. CLS outperforms 66.13% of its industry peers.
- CLS has a Debt/Equity ratio of 0.49. This is a healthy value indicating a solid balance between debt and equity.
Profitability Insights: CLS
ChartMill employs its own Profitability Rating system for stock evaluation. This score, ranging from 0 to 10, is derived from an analysis of diverse profitability metrics and margins. In the case of CLS, the assigned 8 is noteworthy for profitability:
- CLS's Return On Assets of 6.25% is fine compared to the rest of the industry. CLS outperforms 79.03% of its industry peers.
- CLS's Return On Equity of 20.36% is amongst the best of the industry. CLS outperforms 89.52% of its industry peers.
- With an excellent Return On Invested Capital value of 14.12%, CLS belongs to the best of the industry, outperforming 91.94% of the companies in the same industry.
- CLS had an Average Return On Invested Capital over the past 3 years of 11.43%. This is above the industry average of 9.15%.
- The 3 year average ROIC (11.43%) for CLS is below the current ROIC(14.12%), indicating increased profibility in the last year.
- CLS has a better Profit Margin (4.01%) than 69.35% of its industry peers.
- In the last couple of years the Profit Margin of CLS has grown nicely.
- The Operating Margin of CLS (5.51%) is better than 68.55% of its industry peers.
- CLS's Operating Margin has improved in the last couple of years.
- In the last couple of years the Gross Margin of CLS has grown nicely.
How does the Setup look for CLS
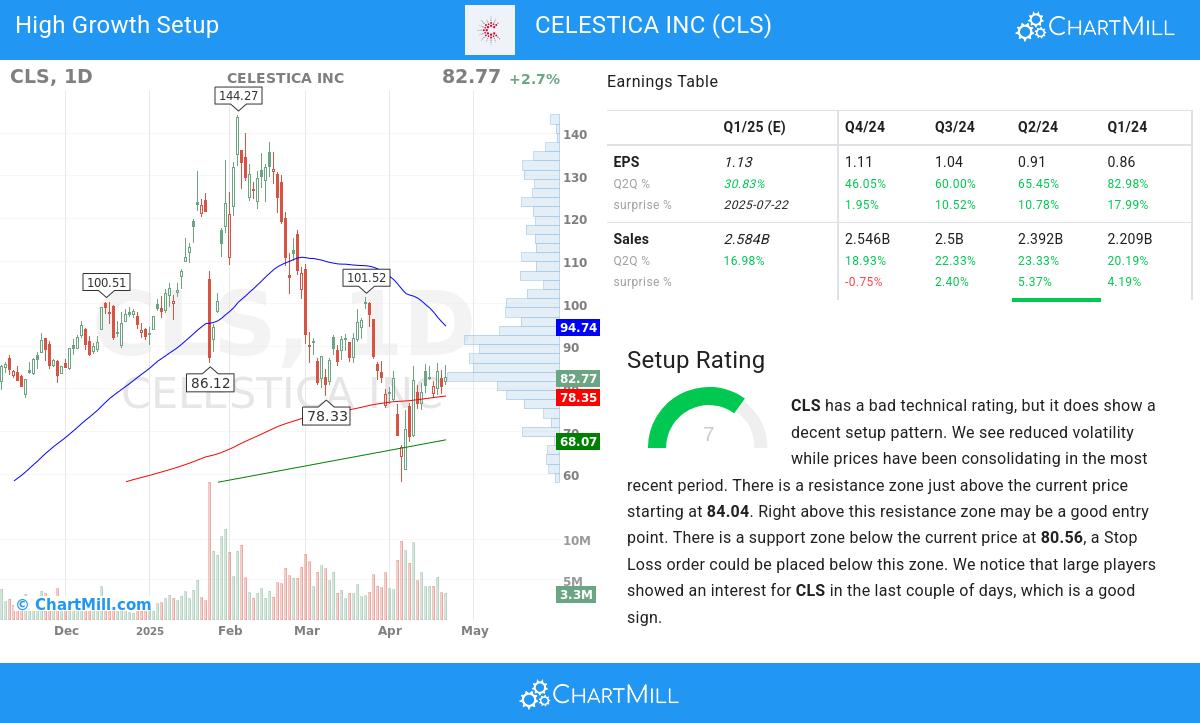
ChartMill also assigns a Setup Rating to each stock. This rating, on a scale of 0 to 10, reflects the degree of consolidation observed based on short-term technical indicators. Currently, CLS exhibits a 7 setup rating, indicating its consolidation status in recent days and weeks.
CLS has a bad technical rating, but it does show a decent setup pattern. Prices have been consolidating lately and the volatility has been reduced. There is a resistance zone just above the current price starting at 84.04. Right above this resistance zone may be a good entry point. There is a support zone below the current price at 80.56, a Stop Loss order could be placed below this zone. We notice that large players showed an interest for CLS in the last couple of days, which is a good sign.
Our Strong Growth screener lists more Strong Growth stocks and is updated daily.
Check the latest full fundamental report of CLS for a complete fundamental analysis.
Check the latest full technical report of CLS for a complete technical analysis.
Keep in mind
This is not investing advice! The article highlights some of the observations at the time of writing, but you should always make your own analysis and invest based on your own insights.
82.77
+2.18 (+2.71%)
Find more stocks in the Stock Screener
CLS Latest News and Analysis
 3 minutes ago - ChartmillCELESTICA INC (NYSE:CLS)—A High-Growth Stock Gearing Up for Its Next Upward Move.
Based on a technical and fundamental analysis of NYSE:CLS we ask: Why CELESTICA INC (NYSE:CLS) Is a Promising High-Growth Stock in the Midst of Consolidation.
 12 days ago - ChartmillCELESTICA INC (NYSE:CLS) is showing good growth, while it is not too expensive.
Based on Fundamental Analysis it can be said that NYSE:CLS is a growth stock which is not overvalued.
