
NASDAQ:CELH—A High-Growth Stock Gearing Up for Its Next Upward Move.
By Mill Chart
Last update: Oct 22, 2024
For growth-minded investors, high revenue and EPS growth are key criteria. Today, we'll examine whether CELSIUS HOLDINGS INC (NASDAQ:CELH) fits the bill for growth investing, particularly as it forms a base and hints at a potential breakout. Remember, due diligence is essential, but CELSIUS HOLDINGS INC has caught our attention on our screen for growth with base formation. It may warrant additional investigation.
Unpacking NASDAQ:CELH's Growth Rating
ChartMill assigns a Growth Rating to each stock, ranging from 0 to 10. This rating is determined by analyzing different growth elements, including EPS and revenue growth, spanning both historical and future figures. In the case of NASDAQ:CELH, the assigned 9 reflects its growth potential:
- The Earnings Per Share has grown by an impressive 2078.89% over the past year.
- Measured over the past years, CELH shows a very strong growth in Earnings Per Share. The EPS has been growing by 91.57% on average per year.
- CELH shows a strong growth in Revenue. In the last year, the Revenue has grown by 56.50%.
- CELH shows a strong growth in Revenue. Measured over the last years, the Revenue has been growing by 90.45% yearly.
- The Earnings Per Share is expected to grow by 28.82% on average over the next years. This is a very strong growth
- CELH is expected to show quite a strong growth in Revenue. In the coming years, the Revenue will grow by 19.78% yearly.
A Closer Look at Health for NASDAQ:CELH
To gauge a stock's financial health, ChartMill utilizes a Health Rating on a scale of 0 to 10. This comprehensive evaluation encompasses liquidity and solvency, both in absolute terms and in comparison to industry peers. NASDAQ:CELH has earned a 8 out of 10:
- An Altman-Z score of 11.86 indicates that CELH is not in any danger for bankruptcy at the moment.
- The Altman-Z score of CELH (11.86) is better than 90.32% of its industry peers.
- CELH has a debt to FCF ratio of 0.00. This is a very positive value and a sign of high solvency as it would only need 0.00 years to pay back of all of its debts.
- CELH has a better Debt to FCF ratio (0.00) than 90.32% of its industry peers.
- CELH has a Debt/Equity ratio of 0.00. This is a healthy value indicating a solid balance between debt and equity.
- CELH has a better Debt to Equity ratio (0.00) than 87.10% of its industry peers.
- A Current Ratio of 4.43 indicates that CELH has no problem at all paying its short term obligations.
- Looking at the Current ratio, with a value of 4.43, CELH belongs to the top of the industry, outperforming 93.55% of the companies in the same industry.
- CELH has a Quick Ratio of 3.85. This indicates that CELH is financially healthy and has no problem in meeting its short term obligations.
- CELH's Quick ratio of 3.85 is amongst the best of the industry. CELH outperforms 100.00% of its industry peers.
Evaluating Profitability: NASDAQ:CELH
Discover ChartMill's exclusive Profitability Rating, a proprietary metric that assesses stocks on a scale of 0 to 10. It takes into consideration various profitability ratios and margins, both in absolute terms and relative to industry peers. Notably, NASDAQ:CELH has achieved a 7:
- CELH's Return On Assets of 14.03% is amongst the best of the industry. CELH outperforms 90.32% of its industry peers.
- CELH has a better Return On Equity (19.44%) than 70.97% of its industry peers.
- The Return On Invested Capital of CELH (18.91%) is better than 90.32% of its industry peers.
- Looking at the Profit Margin, with a value of 16.18%, CELH belongs to the top of the industry, outperforming 80.65% of the companies in the same industry.
- CELH's Profit Margin has improved in the last couple of years.
- Looking at the Operating Margin, with a value of 22.95%, CELH is in the better half of the industry, outperforming 67.74% of the companies in the same industry.
- In the last couple of years the Operating Margin of CELH has grown nicely.
- CELH's Gross Margin has improved in the last couple of years.
How do we evaluate the setup for NASDAQ:CELH?
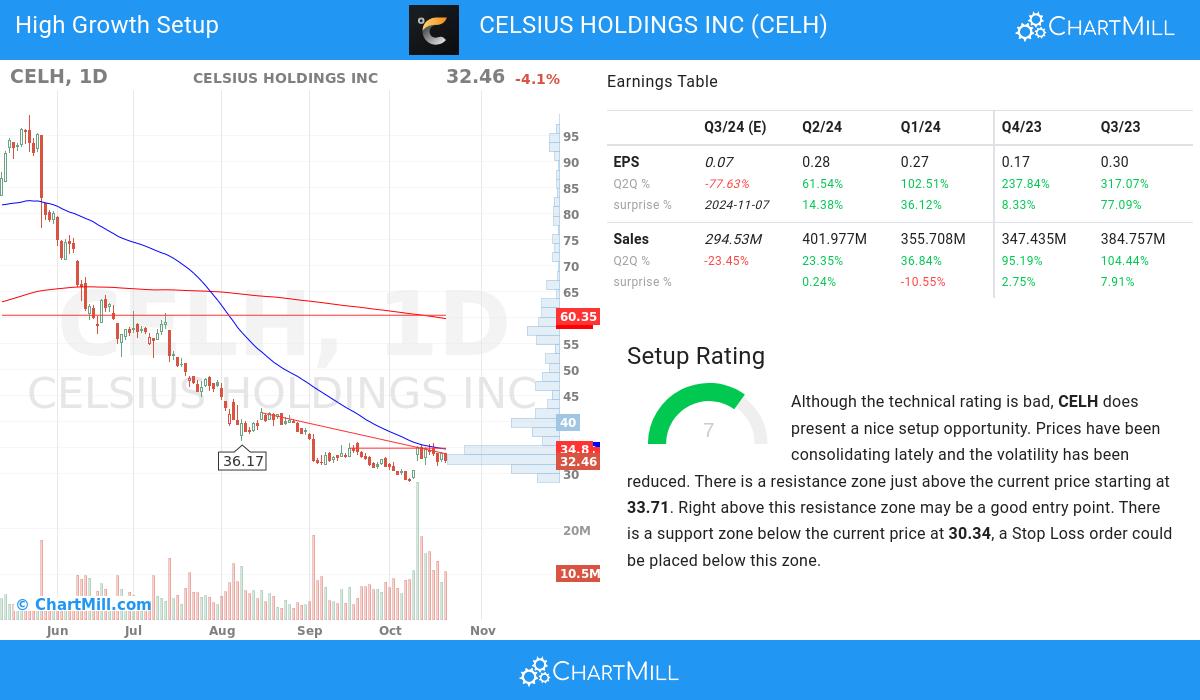
ChartMill incorporates a Setup Rating in its analysis, which measures the extent of consolidation in a stock over recent days and weeks. This rating, ranging from 0 to 10, is updated daily and takes into account multiple short-term technical indicators. The current setup rating for NASDAQ:CELH is 7:
CELH has a bad technical rating, but it does show a decent setup pattern. Prices have been consolidating lately and the volatility has been reduced. There is a resistance zone just above the current price starting at 33.71. Right above this resistance zone may be a good entry point. There is a support zone below the current price at 30.34, a Stop Loss order could be placed below this zone.
Our Strong Growth screener lists more Strong Growth stocks and is updated daily.
Our latest full fundamental report of CELH contains the most current fundamental analsysis.
Check the latest full technical report of CELH for a complete technical analysis.
Keep in mind
This is not investing advice! The article highlights some of the observations at the time of writing, but you should always make your own analysis and invest based on your own insights.
