NASDAQ:CALM is a prime example of a stock that offers more than what meets the eye in terms of fundamentals.
By Mill Chart
Last update: Feb 11, 2025
Discover CAL-MAINE FOODS INC (NASDAQ:CALM)—an undervalued stock our stock screener has picked out. NASDAQ:CALM demonstrates solid fundamentals, including health and profitability, all while staying attractively priced. Let's explore the details.
Evaluating Valuation: NASDAQ:CALM
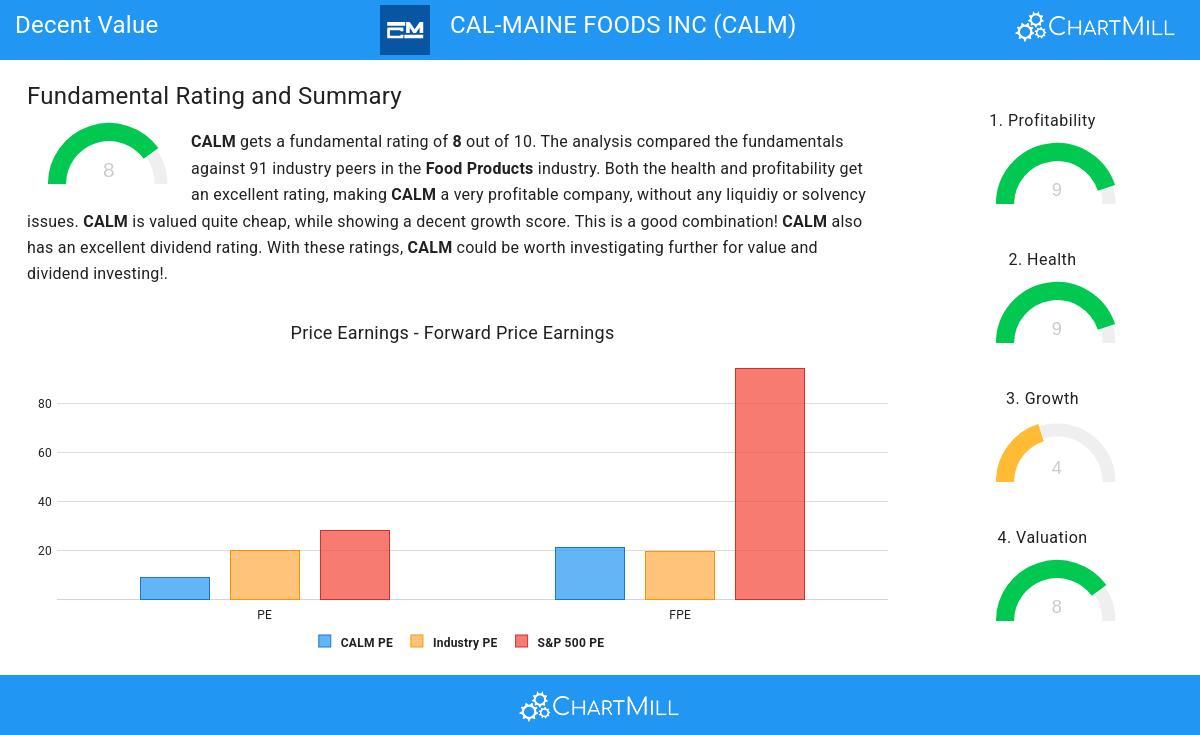
ChartMill provides a Valuation Rating to every stock, ranging from 0 to 10. This rating assesses various valuation aspects, comparing price to earnings and cash flows, while considering factors like profitability and growth. NASDAQ:CALM boasts a 8 out of 10:
- CALM is valuated reasonably with a Price/Earnings ratio of 8.95.
- Based on the Price/Earnings ratio, CALM is valued cheaper than 90.70% of the companies in the same industry.
- When comparing the Price/Earnings ratio of CALM to the average of the S&P500 Index (28.20), we can say CALM is valued rather cheaply.
- Based on the Price/Forward Earnings ratio, CALM is valued a bit cheaper than 61.63% of the companies in the same industry.
- Compared to an average S&P500 Price/Forward Earnings ratio of 94.48, CALM is valued rather cheaply.
- 90.70% of the companies in the same industry are more expensive than CALM, based on the Enterprise Value to EBITDA ratio.
- Based on the Price/Free Cash Flow ratio, CALM is valued cheaper than 80.23% of the companies in the same industry.
- CALM's low PEG Ratio(NY), which compensates the Price/Earnings for growth, indicates a rather cheap valuation of the company.
- The excellent profitability rating of CALM may justify a higher PE ratio.
Looking at the Profitability
ChartMill assigns a proprietary Profitability Rating to each stock. The score is computed by evaluating various profitability ratios and margins and ranges from 0 to 10. NASDAQ:CALM was assigned a score of 9 for profitability:
- The Return On Assets of CALM (25.26%) is better than 97.67% of its industry peers.
- The Return On Equity of CALM (30.75%) is better than 96.51% of its industry peers.
- CALM has a Return On Invested Capital of 25.48%. This is amongst the best in the industry. CALM outperforms 98.84% of its industry peers.
- CALM had an Average Return On Invested Capital over the past 3 years of 20.77%. This is significantly above the industry average of 8.96%.
- The 3 year average ROIC (20.77%) for CALM is below the current ROIC(25.48%), indicating increased profibility in the last year.
- The Profit Margin of CALM (20.39%) is better than 96.51% of its industry peers.
- In the last couple of years the Profit Margin of CALM has grown nicely.
- CALM has a better Operating Margin (24.15%) than 98.84% of its industry peers.
- In the last couple of years the Operating Margin of CALM has grown nicely.
- CALM has a Gross Margin of 32.68%. This is in the better half of the industry: CALM outperforms 73.26% of its industry peers.
- In the last couple of years the Gross Margin of CALM has grown nicely.
Health Analysis for NASDAQ:CALM
ChartMill employs a unique Health Rating system for all stocks. This rating, ranging from 0 to 10, is determined by analyzing various liquidity and solvency ratios. For NASDAQ:CALM, the assigned 9 for health provides valuable insights:
- CALM has an Altman-Z score of 10.44. This indicates that CALM is financially healthy and has little risk of bankruptcy at the moment.
- CALM has a better Altman-Z score (10.44) than 96.51% of its industry peers.
- CALM has no outstanding debt. Therefor its Debt/Equity and Debt/FCF ratios are 0 and belong to the best of the industry.
- A Current Ratio of 5.46 indicates that CALM has no problem at all paying its short term obligations.
- CALM's Current ratio of 5.46 is amongst the best of the industry. CALM outperforms 96.51% of its industry peers.
- CALM has a Quick Ratio of 4.32. This indicates that CALM is financially healthy and has no problem in meeting its short term obligations.
- The Quick ratio of CALM (4.32) is better than 95.35% of its industry peers.
Growth Assessment of NASDAQ:CALM
To evaluate a stock's growth potential, ChartMill utilizes a Growth Rating on a scale of 0 to 10. This comprehensive assessment considers various growth aspects, including historical and estimated EPS and revenue growth. NASDAQ:CALM has achieved a 4 out of 10:
- CALM shows a strong growth in Earnings Per Share. In the last year, the EPS has been growing by 31.97%, which is quite impressive.
- CALM shows a strong growth in Earnings Per Share. Measured over the last years, the EPS has been growing by 34.26% yearly.
- CALM shows quite a strong growth in Revenue. In the last year, the Revenue has grown by 15.58%.
- The Revenue has been growing by 11.32% on average over the past years. This is quite good.
Every day, new Decent Value stocks can be found on ChartMill in our Decent Value screener.
For an up to date full fundamental analysis you can check the fundamental report of CALM
Keep in mind
Important Note: The content of this article is not intended as trading advice. It is essential to perform your own analysis and exercise caution when making trading decisions. The article presents observations created by automated analysis but does not guarantee any trading or investment outcomes. Always trade responsibly and make independent judgments.
NASDAQ:CALM (2/19/2025, 3:08:06 PM)
91.21
+0.25 (+0.27%)
Find more stocks in the Stock Screener
CALM Latest News and Analysis
 2 days ago - ChartmillAnalyzing NASDAQ:CALM's Dividend Potential.
Why CAL-MAINE FOODS INC (NASDAQ:CALM) is a Top Pick for Dividend Investors.
 8 days ago - ChartmillNASDAQ:CALM is a prime example of a stock that offers more than what meets the eye in terms of fundamentals.
Consider CAL-MAINE FOODS INC as a top value stock. NASDAQ:CALM shines in terms of profitability, solvency, and liquidity, all while remaining very reasonably priced.
