
Our stock screening tool has pinpointed CALERES INC (NYSE:CAL) as an undervalued stock option. NYSE:CAL retains a strong financial foundation and an attractive price tag. Let's delve into the specifics below.
What does the Valuation looks like for NYSE:CAL
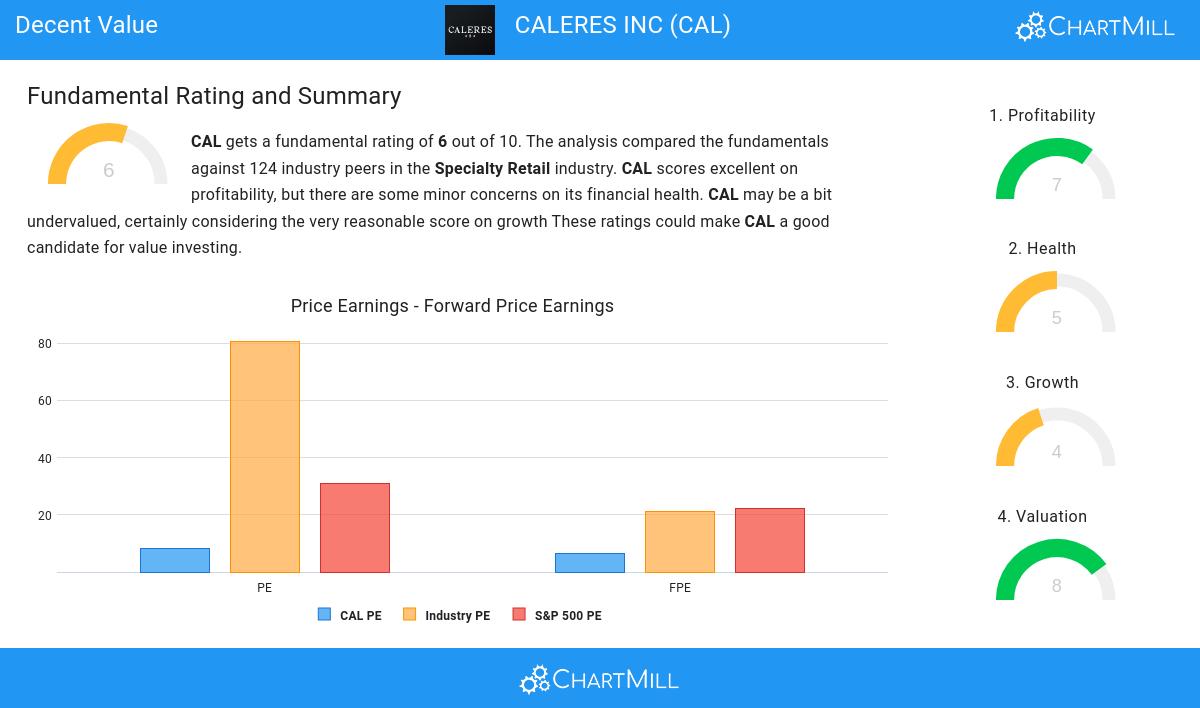
ChartMill employs its own Valuation Rating system for all stocks. This score, ranging from 0 to 10, is determined by evaluating different valuation factors, including price to earnings and free cash flow, both in absolute terms and relative to the market and industry. NYSE:CAL has earned a 8 for valuation:
- With a Price/Earnings ratio of 8.21, the valuation of CAL can be described as very reasonable.
- Based on the Price/Earnings ratio, CAL is valued cheaply inside the industry as 94.26% of the companies are valued more expensively.
- CAL's Price/Earnings ratio indicates a rather cheap valuation when compared to the S&P500 average which is at 31.01.
- With a Price/Forward Earnings ratio of 6.35, the valuation of CAL can be described as very cheap.
- Based on the Price/Forward Earnings ratio, CAL is valued cheaply inside the industry as 99.18% of the companies are valued more expensively.
- When comparing the Price/Forward Earnings ratio of CAL to the average of the S&P500 Index (22.36), we can say CAL is valued rather cheaply.
- Based on the Enterprise Value to EBITDA ratio, CAL is valued cheaper than 95.08% of the companies in the same industry.
- 90.16% of the companies in the same industry are more expensive than CAL, based on the Price/Free Cash Flow ratio.
- CAL has a very decent profitability rating, which may justify a higher PE ratio.
Profitability Insights: NYSE:CAL
ChartMill employs its own Profitability Rating system for stock evaluation. This score, ranging from 0 to 10, is derived from an analysis of diverse profitability metrics and margins. In the case of NYSE:CAL, the assigned 7 is noteworthy for profitability:
- The Return On Assets of CAL (7.76%) is better than 79.51% of its industry peers.
- CAL has a Return On Equity of 25.87%. This is amongst the best in the industry. CAL outperforms 81.15% of its industry peers.
- With an excellent Return On Invested Capital value of 12.76%, CAL belongs to the best of the industry, outperforming 81.97% of the companies in the same industry.
- Measured over the past 3 years, the Average Return On Invested Capital for CAL is above the industry average of 12.30%.
- Looking at the Profit Margin, with a value of 5.60%, CAL is in the better half of the industry, outperforming 77.87% of the companies in the same industry.
- Looking at the Operating Margin, with a value of 6.64%, CAL is in the better half of the industry, outperforming 75.41% of the companies in the same industry.
- CAL's Operating Margin has improved in the last couple of years.
- Looking at the Gross Margin, with a value of 45.19%, CAL is in the better half of the industry, outperforming 71.31% of the companies in the same industry.
- CAL's Gross Margin has improved in the last couple of years.
Health Assessment of NYSE:CAL
ChartMill utilizes a Health Rating to assess stocks, scoring them on a scale of 0 to 10. This rating takes into account a variety of liquidity and solvency ratios, both in absolute terms and in comparison to industry peers. NYSE:CAL has earned a 5 out of 10:
- The Debt to FCF ratio of CAL is 1.08, which is an excellent value as it means it would take CAL, only 1.08 years of fcf income to pay off all of its debts.
- The Debt to FCF ratio of CAL (1.08) is better than 78.69% of its industry peers.
- CAL has a Debt/Equity ratio of 0.24. This is a healthy value indicating a solid balance between debt and equity.
Understanding NYSE:CAL's Growth
A key component of ChartMill's stock assessment is the Growth Rating, which spans from 0 to 10. This rating evaluates diverse growth factors, such as EPS and revenue growth, considering both past performance and future projections. NYSE:CAL has received a 4 out of 10:
- Measured over the past years, CAL shows a quite strong growth in Earnings Per Share. The EPS has been growing by 13.59% on average per year.
- Based on estimates for the next years, CAL will show a quite strong growth in Earnings Per Share. The EPS will grow by 10.80% on average per year.
- The Revenue growth rate is accelerating: in the next years the growth will be better than in the last years.
More Decent Value stocks can be found in our Decent Value screener.
For an up to date full fundamental analysis you can check the fundamental report of CAL
Keep in mind
Important Note: The content of this article is not intended as trading advice. It is essential to perform your own analysis and exercise caution when making trading decisions. The article presents observations created by automated analysis but does not guarantee any trading or investment outcomes. Always trade responsibly and make independent judgments.