
Take a closer look at BLUE BIRD CORP (NASDAQ:BLBD), a remarkable value stock uncovered by our stock screener. NASDAQ:BLBD excels in fundamentals and maintains a very reasonable valuation. Let's break it down further.
Evaluating Valuation: NASDAQ:BLBD
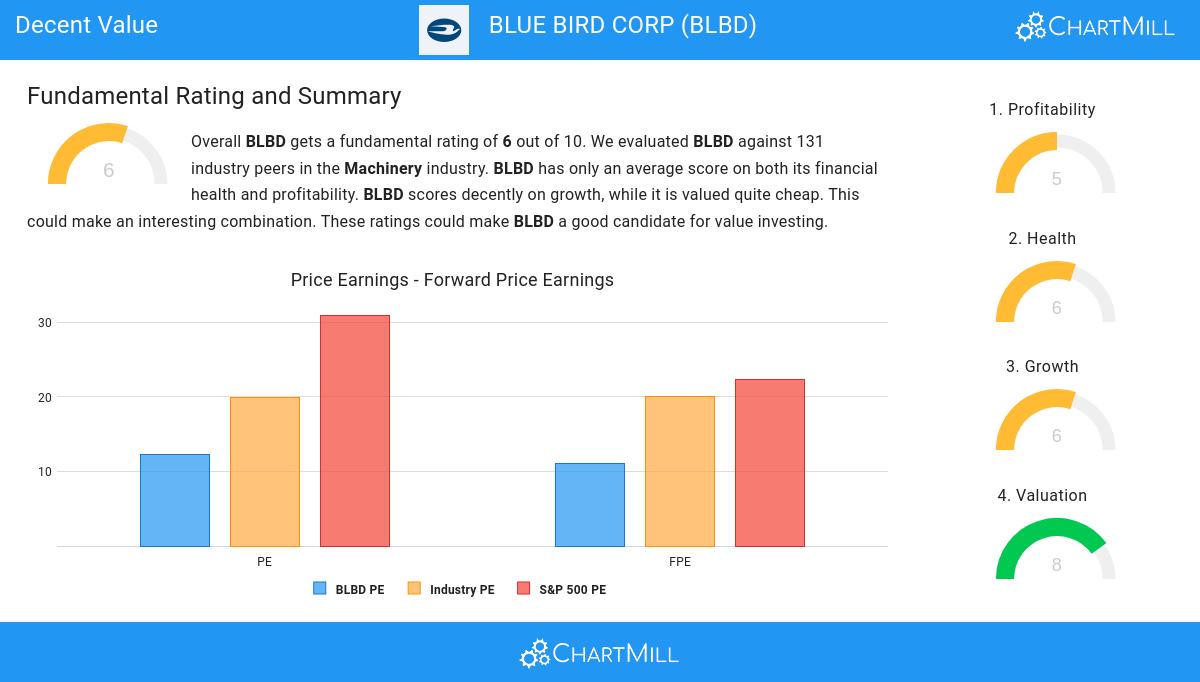
To assess a stock's valuation, ChartMill utilizes a Valuation Rating on a scale of 0 to 10. This comprehensive assessment considers various valuation aspects, comparing price to earnings and cash flows, while factoring in profitability and growth. NASDAQ:BLBD has achieved a 8 out of 10:
- 86.82% of the companies in the same industry are more expensive than BLBD, based on the Price/Earnings ratio.
- The average S&P500 Price/Earnings ratio is at 30.97. BLBD is valued rather cheaply when compared to this.
- The Price/Forward Earnings ratio is 11.09, which indicates a very decent valuation of BLBD.
- BLBD's Price/Forward Earnings ratio is rather cheap when compared to the industry. BLBD is cheaper than 83.72% of the companies in the same industry.
- Compared to an average S&P500 Price/Forward Earnings ratio of 22.29, BLBD is valued rather cheaply.
- 79.84% of the companies in the same industry are more expensive than BLBD, based on the Enterprise Value to EBITDA ratio.
- Compared to the rest of the industry, the Price/Free Cash Flow ratio of BLBD indicates a somewhat cheap valuation: BLBD is cheaper than 75.97% of the companies listed in the same industry.
- The low PEG Ratio(NY), which compensates the Price/Earnings for growth, indicates a rather cheap valuation of the company.
- A more expensive valuation may be justified as BLBD's earnings are expected to grow with 59.26% in the coming years.
Profitability Assessment of NASDAQ:BLBD
Discover ChartMill's exclusive Profitability Rating, a proprietary metric that assesses stocks on a scale of 0 to 10. It takes into consideration various profitability ratios and margins, both in absolute terms and relative to industry peers. Notably, NASDAQ:BLBD has achieved a 5:
- With an excellent Return On Assets value of 21.26%, BLBD belongs to the best of the industry, outperforming 99.22% of the companies in the same industry.
- The Return On Equity of BLBD (72.48%) is better than 98.45% of its industry peers.
- BLBD's Return On Invested Capital of 34.50% is amongst the best of the industry. BLBD outperforms 99.22% of its industry peers.
- With a decent Profit Margin value of 7.65%, BLBD is doing good in the industry, outperforming 62.79% of the companies in the same industry.
- BLBD's Operating Margin has improved in the last couple of years.
How do we evaluate the Health for NASDAQ:BLBD?
Every stock is evaluated by ChartMill, receiving a Health Rating on a scale of 0 to 10. This assessment considers different health aspects, including liquidity and solvency, both in absolute terms and relative to industry peers. NASDAQ:BLBD has achieved a 6 out of 10:
- An Altman-Z score of 6.48 indicates that BLBD is not in any danger for bankruptcy at the moment.
- BLBD's Altman-Z score of 6.48 is amongst the best of the industry. BLBD outperforms 84.50% of its industry peers.
- BLBD has a debt to FCF ratio of 1.23. This is a very positive value and a sign of high solvency as it would only need 1.23 years to pay back of all of its debts.
- BLBD has a Debt to FCF ratio of 1.23. This is amongst the best in the industry. BLBD outperforms 89.92% of its industry peers.
- Although BLBD does not score too well on debt/equity it has very limited outstanding debt, which is well covered by the FCF. We will not put too much weight on the debt/equity number as it may be because of low equity, which could be a consequence of a share buyback program for instance. This needs to be investigated.
Growth Assessment of NASDAQ:BLBD
ChartMill assigns a proprietary Growth Rating to each stock. The score is computed by evaluating various growth aspects, like EPS and revenue growth. We take into account the history as well as the estimated future numbers. NASDAQ:BLBD was assigned a score of 6 for growth:
- The Earnings Per Share has grown by an impressive 1448.00% over the past year.
- BLBD shows quite a strong growth in Revenue. In the last year, the Revenue has grown by 19.53%.
- Based on estimates for the next years, BLBD will show a very strong growth in Earnings Per Share. The EPS will grow by 59.26% on average per year.
- Based on estimates for the next years, BLBD will show a quite strong growth in Revenue. The Revenue will grow by 13.23% on average per year.
- The EPS growth rate is accelerating: in the next years the growth will be better than in the last years.
- When comparing the Revenue growth rate of the last years to the growth rate of the upcoming years, we see that the growth is accelerating.
Every day, new Decent Value stocks can be found on ChartMill in our Decent Value screener.
For an up to date full fundamental analysis you can check the fundamental report of BLBD
Keep in mind
This is not investing advice! The article highlights some of the observations at the time of writing, but you should always make your own analysis and invest based on your own insights.