
When you look at NASDAQ:BIDU, it's hard to ignore the strong fundamentals, especially considering its likely undervaluation.
By Mill Chart
Last update: Feb 6, 2025
Consider BAIDU INC - SPON ADR (NASDAQ:BIDU) as a top value stock, identified by our stock screening tool. NASDAQ:BIDU shines in terms of profitability, solvency, and liquidity, all while remaining very reasonably priced. Let's dive deeper into the analysis.
Looking at the Valuation
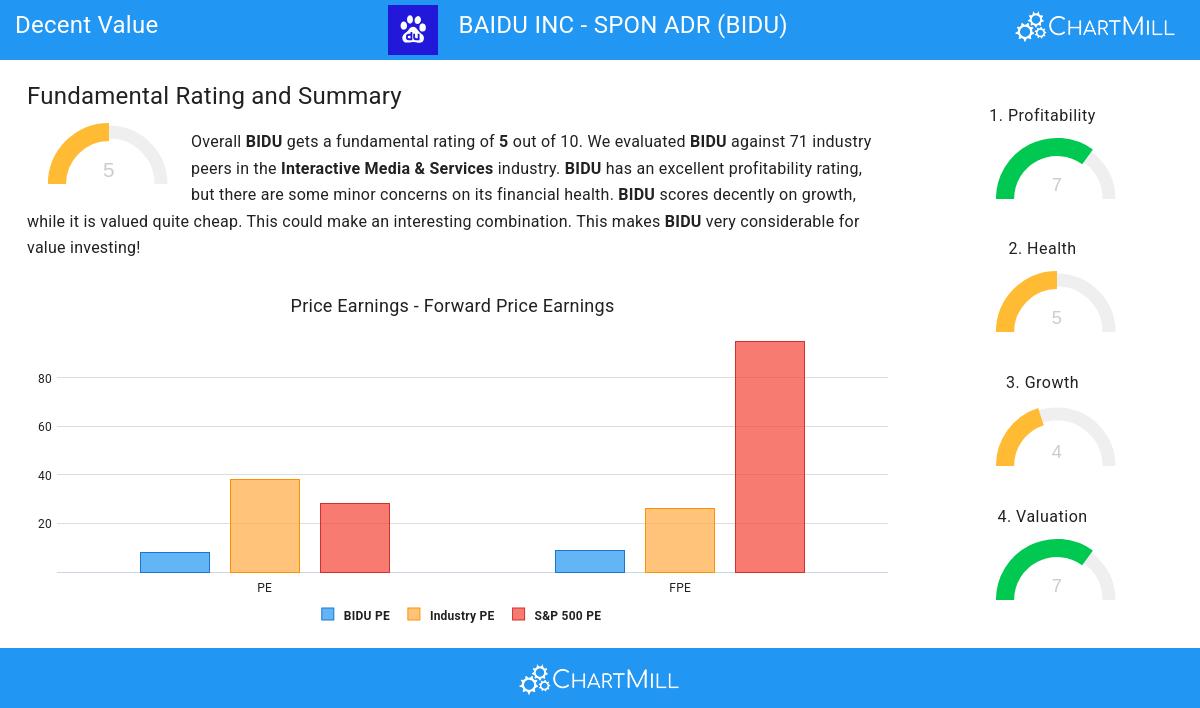
ChartMill assigns a Valuation Rating to each stock, ranging from 0 to 10. This rating is calculated by analyzing different valuation elements, such as price to earnings and free cash flow, both in absolute terms and relative to the market and industry. In the case of NASDAQ:BIDU, the assigned 7 reflects its valuation:
- BIDU is valuated reasonably with a Price/Earnings ratio of 8.12.
- BIDU's Price/Earnings ratio is rather cheap when compared to the industry. BIDU is cheaper than 89.39% of the companies in the same industry.
- BIDU is valuated cheaply when we compare the Price/Earnings ratio to 28.35, which is the current average of the S&P500 Index.
- With a Price/Forward Earnings ratio of 8.83, the valuation of BIDU can be described as very reasonable.
- BIDU's Price/Forward Earnings ratio is rather cheap when compared to the industry. BIDU is cheaper than 90.91% of the companies in the same industry.
- BIDU is valuated cheaply when we compare the Price/Forward Earnings ratio to 95.00, which is the current average of the S&P500 Index.
- 96.97% of the companies in the same industry are more expensive than BIDU, based on the Enterprise Value to EBITDA ratio.
- Compared to the rest of the industry, the Price/Free Cash Flow ratio of BIDU indicates a rather cheap valuation: BIDU is cheaper than 93.94% of the companies listed in the same industry.
- BIDU has a very decent profitability rating, which may justify a higher PE ratio.
Profitability Examination for NASDAQ:BIDU
ChartMill employs its own Profitability Rating system for stock evaluation. This score, ranging from 0 to 10, is derived from an analysis of diverse profitability metrics and margins. In the case of NASDAQ:BIDU, the assigned 7 is noteworthy for profitability:
- BIDU's Return On Assets of 4.90% is fine compared to the rest of the industry. BIDU outperforms 77.27% of its industry peers.
- BIDU's Return On Equity of 7.88% is amongst the best of the industry. BIDU outperforms 81.82% of its industry peers.
- BIDU has a Return On Invested Capital of 5.19%. This is in the better half of the industry: BIDU outperforms 69.70% of its industry peers.
- The 3 year average ROIC (3.96%) for BIDU is below the current ROIC(5.19%), indicating increased profibility in the last year.
- BIDU has a Profit Margin of 15.27%. This is amongst the best in the industry. BIDU outperforms 83.33% of its industry peers.
- Looking at the Operating Margin, with a value of 16.98%, BIDU belongs to the top of the industry, outperforming 83.33% of the companies in the same industry.
Health Analysis for NASDAQ:BIDU
To gauge a stock's financial health, ChartMill utilizes a Health Rating on a scale of 0 to 10. This comprehensive evaluation encompasses liquidity and solvency, both in absolute terms and in comparison to industry peers. NASDAQ:BIDU has earned a 5 out of 10:
- BIDU has a debt to FCF ratio of 2.35. This is a good value and a sign of high solvency as BIDU would need 2.35 years to pay back of all of its debts.
- BIDU's Debt to FCF ratio of 2.35 is fine compared to the rest of the industry. BIDU outperforms 72.73% of its industry peers.
- A Debt/Equity ratio of 0.24 indicates that BIDU is not too dependend on debt financing.
- A Current Ratio of 2.19 indicates that BIDU has no problem at all paying its short term obligations.
- A Quick Ratio of 2.19 indicates that BIDU has no problem at all paying its short term obligations.
A Closer Look at Growth for NASDAQ:BIDU
ChartMill assigns a proprietary Growth Rating to each stock. The score is computed by evaluating various growth aspects, like EPS and revenue growth. We take into account the history as well as the estimated future numbers. NASDAQ:BIDU was assigned a score of 4 for growth:
- When comparing the EPS growth rate of the last years to the growth rate of the upcoming years, we see that the growth is accelerating.
More Decent Value stocks can be found in our Decent Value screener.
Check the latest full fundamental report of BIDU for a complete fundamental analysis.
Keep in mind
This article should in no way be interpreted as advice. The article is based on the observed metrics at the time of writing, but you should always make your own analysis and trade or invest at your own responsibility.
NASDAQ:BIDU (4/24/2025, 12:36:04 PM)
88.86
+1.35 (+1.54%)
Find more stocks in the Stock Screener
