
For those who appreciate value investing, NASDAQ:BIDU is a compelling option with its solid fundamentals.
By Mill Chart
Last update: Oct 22, 2024
Uncover the potential of BAIDU INC - SPON ADR (NASDAQ:BIDU) as our stock screener's choice for an undervalued stock. NASDAQ:BIDU maintains a strong financial position and offers an appealing valuation. We'll delve into the specifics below.
Looking at the Valuation
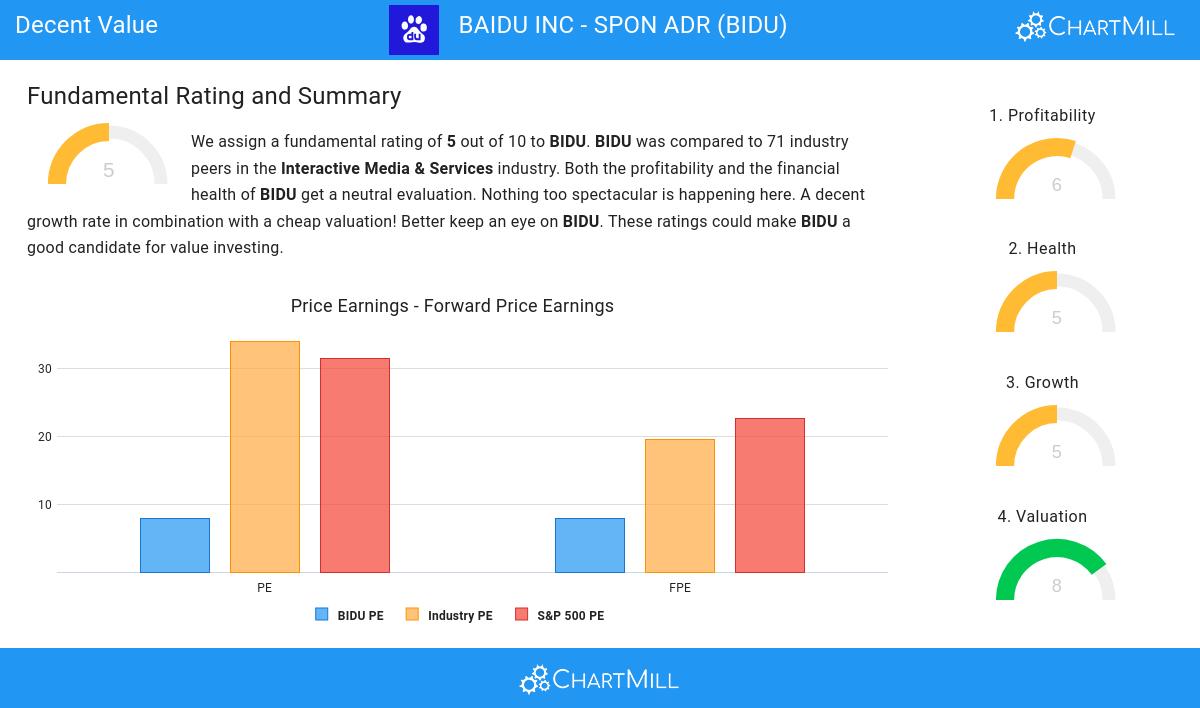
ChartMill assigns a Valuation Rating to every stock. This score ranges from 0 to 10 and evaluates the different valuation aspects and compares the price to earnings and cash flows, while taking into account profitability and growth. NASDAQ:BIDU scores a 8 out of 10:
- A Price/Earnings ratio of 7.83 indicates a rather cheap valuation of BIDU.
- BIDU's Price/Earnings ratio is rather cheap when compared to the industry. BIDU is cheaper than 88.57% of the companies in the same industry.
- Compared to an average S&P500 Price/Earnings ratio of 31.46, BIDU is valued rather cheaply.
- With a Price/Forward Earnings ratio of 7.94, the valuation of BIDU can be described as very cheap.
- 88.57% of the companies in the same industry are more expensive than BIDU, based on the Price/Forward Earnings ratio.
- BIDU is valuated cheaply when we compare the Price/Forward Earnings ratio to 22.63, which is the current average of the S&P500 Index.
- Based on the Enterprise Value to EBITDA ratio, BIDU is valued cheaply inside the industry as 97.14% of the companies are valued more expensively.
- Compared to the rest of the industry, the Price/Free Cash Flow ratio of BIDU indicates a rather cheap valuation: BIDU is cheaper than 97.14% of the companies listed in the same industry.
- BIDU has a very decent profitability rating, which may justify a higher PE ratio.
Understanding NASDAQ:BIDU's Profitability
ChartMill employs its own Profitability Rating system for stock evaluation. This score, ranging from 0 to 10, is derived from an analysis of diverse profitability metrics and margins. In the case of NASDAQ:BIDU, the assigned 6 is noteworthy for profitability:
- BIDU has a better Return On Assets (4.69%) than 78.57% of its industry peers.
- BIDU has a Return On Equity of 7.71%. This is in the better half of the industry: BIDU outperforms 80.00% of its industry peers.
- BIDU's Return On Invested Capital of 5.32% is fine compared to the rest of the industry. BIDU outperforms 77.14% of its industry peers.
- The last Return On Invested Capital (5.32%) for BIDU is above the 3 year average (3.96%), which is a sign of increasing profitability.
- The Profit Margin of BIDU (14.46%) is better than 84.29% of its industry peers.
- BIDU has a Operating Margin of 17.13%. This is amongst the best in the industry. BIDU outperforms 84.29% of its industry peers.
Deciphering NASDAQ:BIDU's Health Rating
Every stock is evaluated by ChartMill, receiving a Health Rating on a scale of 0 to 10. This assessment considers different health aspects, including liquidity and solvency, both in absolute terms and relative to industry peers. NASDAQ:BIDU has achieved a 5 out of 10:
- BIDU has a debt to FCF ratio of 2.15. This is a good value and a sign of high solvency as BIDU would need 2.15 years to pay back of all of its debts.
- With a decent Debt to FCF ratio value of 2.15, BIDU is doing good in the industry, outperforming 75.71% of the companies in the same industry.
- BIDU has a Debt/Equity ratio of 0.25. This is a healthy value indicating a solid balance between debt and equity.
- Although BIDU does not score too well on debt/equity it has very limited outstanding debt, which is well covered by the FCF. We will not put too much weight on the debt/equity number as it may be because of low equity, which could be a consequence of a share buyback program for instance. This needs to be investigated.
- BIDU has a Current Ratio of 2.32. This indicates that BIDU is financially healthy and has no problem in meeting its short term obligations.
- BIDU has a Quick Ratio of 2.32. This indicates that BIDU is financially healthy and has no problem in meeting its short term obligations.
A Closer Look at Growth for NASDAQ:BIDU
ChartMill employs its own Growth Rating system for all stocks. This score, ranging from 0 to 10, is derived by evaluating different growth factors, such as EPS and revenue growth, taking into account both past performance and future projections. NASDAQ:BIDU has earned a 5 for growth:
- BIDU shows a strong growth in Earnings Per Share. In the last year, the EPS has been growing by 17.45%, which is quite good.
- BIDU is expected to show quite a strong growth in Earnings Per Share. In the coming years, the EPS will grow by 10.44% yearly.
- The EPS growth rate is accelerating: in the next years the growth will be better than in the last years.
- The Revenue growth rate is accelerating: in the next years the growth will be better than in the last years.
More Decent Value stocks can be found in our Decent Value screener.
Check the latest full fundamental report of BIDU for a complete fundamental analysis.
Keep in mind
This article should in no way be interpreted as advice. The article is based on the observed metrics at the time of writing, but you should always make your own analysis and trade or invest at your own responsibility.
