
NASDAQ:BIDU: good value for what you're paying.
By Mill Chart
Last update: Oct 1, 2024
Uncover the hidden value in BAIDU INC - SPON ADR (NASDAQ:BIDU) as our stock screening tool recommends it as an undervalued choice. NASDAQ:BIDU maintains a robust financial position and offers an attractive pricing perspective. Let's dig deeper into the analysis.
Valuation Analysis for NASDAQ:BIDU
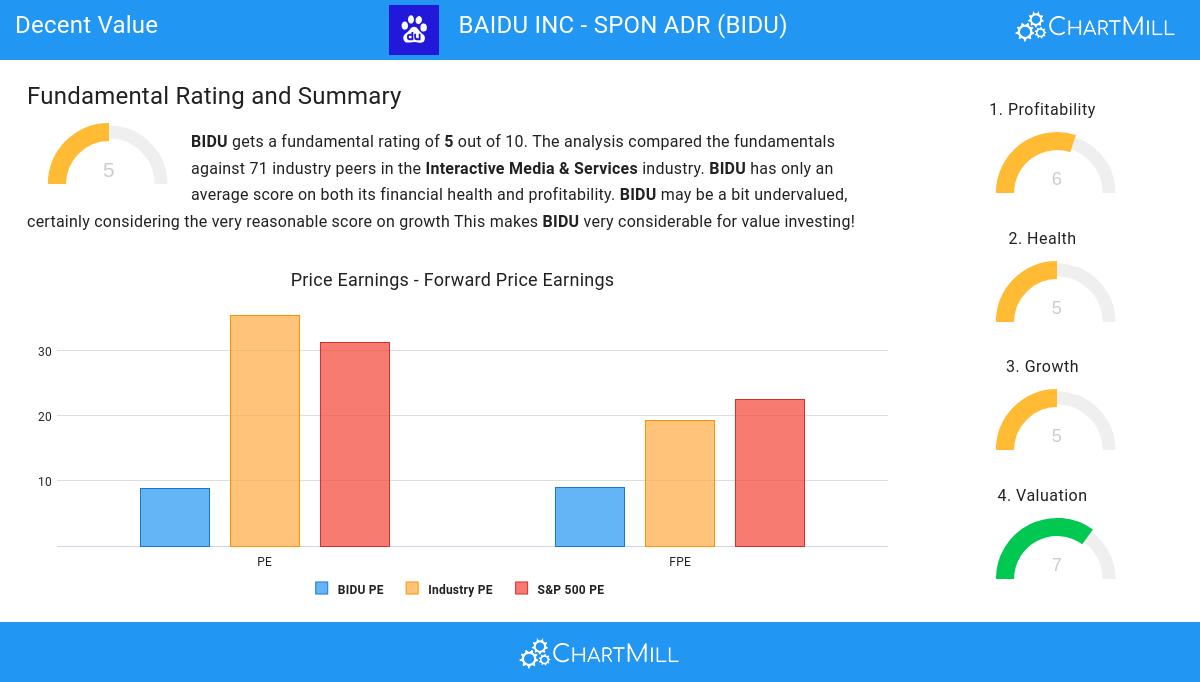
ChartMill assigns a Valuation Rating to each stock, ranging from 0 to 10. This rating is calculated by analyzing different valuation elements, such as price to earnings and free cash flow, both in absolute terms and relative to the market and industry. In the case of NASDAQ:BIDU, the assigned 7 reflects its valuation:
- With a Price/Earnings ratio of 8.87, the valuation of BIDU can be described as very reasonable.
- Based on the Price/Earnings ratio, BIDU is valued cheaper than 87.14% of the companies in the same industry.
- When comparing the Price/Earnings ratio of BIDU to the average of the S&P500 Index (31.26), we can say BIDU is valued rather cheaply.
- A Price/Forward Earnings ratio of 8.99 indicates a reasonable valuation of BIDU.
- Compared to the rest of the industry, the Price/Forward Earnings ratio of BIDU indicates a rather cheap valuation: BIDU is cheaper than 84.29% of the companies listed in the same industry.
- BIDU's Price/Forward Earnings ratio indicates a rather cheap valuation when compared to the S&P500 average which is at 22.55.
- 97.14% of the companies in the same industry are more expensive than BIDU, based on the Enterprise Value to EBITDA ratio.
- BIDU's Price/Free Cash Flow ratio is rather cheap when compared to the industry. BIDU is cheaper than 97.14% of the companies in the same industry.
- The decent profitability rating of BIDU may justify a higher PE ratio.
Looking at the Profitability
ChartMill's Profitability Rating offers a unique perspective on stock analysis, providing scores from 0 to 10. These ratings consider a wide range of profitability metrics and margins, both in comparison to industry peers and on their own merits. For NASDAQ:BIDU, the assigned 6 is a significant indicator of profitability:
- Looking at the Return On Assets, with a value of 4.69%, BIDU is in the better half of the industry, outperforming 78.57% of the companies in the same industry.
- With a decent Return On Equity value of 7.71%, BIDU is doing good in the industry, outperforming 80.00% of the companies in the same industry.
- Looking at the Return On Invested Capital, with a value of 5.32%, BIDU is in the better half of the industry, outperforming 77.14% of the companies in the same industry.
- The 3 year average ROIC (3.96%) for BIDU is below the current ROIC(5.32%), indicating increased profibility in the last year.
- The Profit Margin of BIDU (14.46%) is better than 84.29% of its industry peers.
- Looking at the Operating Margin, with a value of 17.13%, BIDU belongs to the top of the industry, outperforming 84.29% of the companies in the same industry.
Understanding NASDAQ:BIDU's Health Score
To gauge a stock's financial health, ChartMill utilizes a Health Rating on a scale of 0 to 10. This comprehensive evaluation encompasses liquidity and solvency, both in absolute terms and in comparison to industry peers. NASDAQ:BIDU has earned a 5 out of 10:
- The Debt to FCF ratio of BIDU is 2.15, which is a good value as it means it would take BIDU, 2.15 years of fcf income to pay off all of its debts.
- Looking at the Debt to FCF ratio, with a value of 2.15, BIDU is in the better half of the industry, outperforming 75.71% of the companies in the same industry.
- BIDU has a Debt/Equity ratio of 0.25. This is a healthy value indicating a solid balance between debt and equity.
- Even though the debt/equity ratio score it not favorable for BIDU, it has very limited outstanding debt, so we won't put too much weight on the DE evaluation.
- BIDU has a Current Ratio of 2.32. This indicates that BIDU is financially healthy and has no problem in meeting its short term obligations.
- A Quick Ratio of 2.32 indicates that BIDU has no problem at all paying its short term obligations.
Evaluating Growth: NASDAQ:BIDU
ChartMill employs its own Growth Rating system for all stocks. This score, ranging from 0 to 10, is derived by evaluating different growth factors, such as EPS and revenue growth, taking into account both past performance and future projections. NASDAQ:BIDU has earned a 5 for growth:
- BIDU shows a strong growth in Earnings Per Share. In the last year, the EPS has been growing by 17.45%, which is quite good.
- Based on estimates for the next years, BIDU will show a quite strong growth in Earnings Per Share. The EPS will grow by 10.44% on average per year.
- When comparing the EPS growth rate of the last years to the growth rate of the upcoming years, we see that the growth is accelerating.
- The Revenue growth rate is accelerating: in the next years the growth will be better than in the last years.
More Decent Value stocks can be found in our Decent Value screener.
For an up to date full fundamental analysis you can check the fundamental report of BIDU
Keep in mind
This is not investing advice! The article highlights some of the observations at the time of writing, but you should always make your own analysis and invest based on your own insights.
