
When you look at NASDAQ:BIDU, it's hard to ignore the strong fundamentals, especially considering its likely undervaluation.
By Mill Chart
Last update: Sep 6, 2024
Our stock screening tool has identified BAIDU INC - SPON ADR (NASDAQ:BIDU) as an undervalued gem with strong fundamentals. NASDAQ:BIDU boasts decent financial health and profitability while maintaining an attractive price point. We'll break it down further.
Understanding NASDAQ:BIDU's Valuation Score
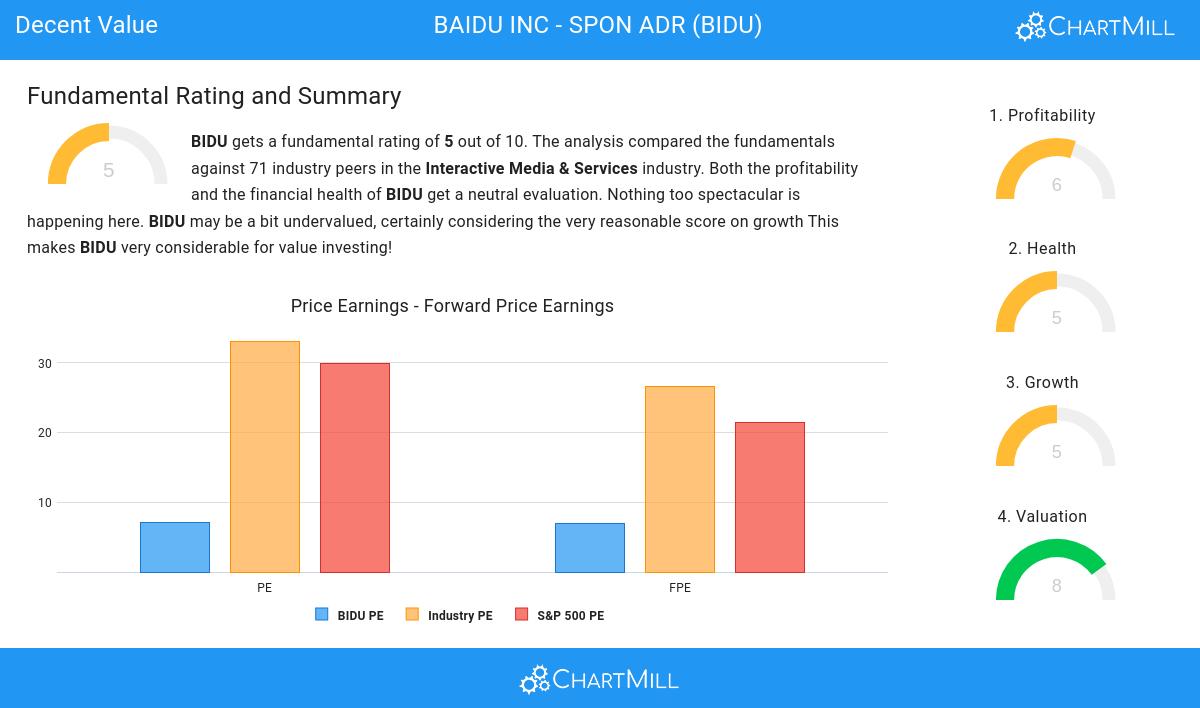
ChartMill provides a Valuation Rating to every stock, ranging from 0 to 10. This rating assesses various valuation aspects, comparing price to earnings and cash flows, while considering factors like profitability and growth. NASDAQ:BIDU boasts a 8 out of 10:
- The Price/Earnings ratio is 7.06, which indicates a rather cheap valuation of BIDU.
- Compared to the rest of the industry, the Price/Earnings ratio of BIDU indicates a rather cheap valuation: BIDU is cheaper than 92.75% of the companies listed in the same industry.
- BIDU's Price/Earnings ratio indicates a rather cheap valuation when compared to the S&P500 average which is at 29.93.
- The Price/Forward Earnings ratio is 7.00, which indicates a rather cheap valuation of BIDU.
- Compared to the rest of the industry, the Price/Forward Earnings ratio of BIDU indicates a rather cheap valuation: BIDU is cheaper than 88.41% of the companies listed in the same industry.
- BIDU's Price/Forward Earnings ratio indicates a rather cheap valuation when compared to the S&P500 average which is at 21.45.
- 98.55% of the companies in the same industry are more expensive than BIDU, based on the Enterprise Value to EBITDA ratio.
- Based on the Price/Free Cash Flow ratio, BIDU is valued cheaper than 95.65% of the companies in the same industry.
- The decent profitability rating of BIDU may justify a higher PE ratio.
Assessing Profitability for NASDAQ:BIDU
ChartMill's Profitability Rating offers a unique perspective on stock analysis, providing scores from 0 to 10. These ratings consider a wide range of profitability metrics and margins, both in comparison to industry peers and on their own merits. For NASDAQ:BIDU, the assigned 6 is a significant indicator of profitability:
- The Return On Assets of BIDU (4.69%) is better than 78.26% of its industry peers.
- Looking at the Return On Equity, with a value of 7.71%, BIDU is in the better half of the industry, outperforming 79.71% of the companies in the same industry.
- With a decent Return On Invested Capital value of 5.32%, BIDU is doing good in the industry, outperforming 76.81% of the companies in the same industry.
- The last Return On Invested Capital (5.32%) for BIDU is above the 3 year average (3.96%), which is a sign of increasing profitability.
- BIDU's Profit Margin of 14.46% is amongst the best of the industry. BIDU outperforms 84.06% of its industry peers.
- The Operating Margin of BIDU (17.13%) is better than 84.06% of its industry peers.
Understanding NASDAQ:BIDU's Health
A critical element of ChartMill's stock evaluation is the Health Rating, which spans from 0 to 10. This rating considers multiple health factors, including liquidity and solvency, both in absolute terms and relative to industry peers. NASDAQ:BIDU has received a 5 out of 10:
- The Debt to FCF ratio of BIDU is 2.15, which is a good value as it means it would take BIDU, 2.15 years of fcf income to pay off all of its debts.
- Looking at the Debt to FCF ratio, with a value of 2.15, BIDU is in the better half of the industry, outperforming 75.36% of the companies in the same industry.
- BIDU has a Debt/Equity ratio of 0.25. This is a healthy value indicating a solid balance between debt and equity.
- Although BIDU does not score too well on debt/equity it has very limited outstanding debt, which is well covered by the FCF. We will not put too much weight on the debt/equity number as it may be because of low equity, which could be a consequence of a share buyback program for instance. This needs to be investigated.
- A Current Ratio of 2.32 indicates that BIDU has no problem at all paying its short term obligations.
- A Quick Ratio of 2.32 indicates that BIDU has no problem at all paying its short term obligations.
Growth Analysis for NASDAQ:BIDU
ChartMill employs its own Growth Rating system for all stocks. This score, ranging from 0 to 10, is derived by evaluating different growth factors, such as EPS and revenue growth, taking into account both past performance and future projections. NASDAQ:BIDU has earned a 5 for growth:
- The Earnings Per Share has grown by an nice 17.45% over the past year.
- Based on estimates for the next years, BIDU will show a quite strong growth in Earnings Per Share. The EPS will grow by 10.44% on average per year.
- When comparing the EPS growth rate of the last years to the growth rate of the upcoming years, we see that the growth is accelerating.
- When comparing the Revenue growth rate of the last years to the growth rate of the upcoming years, we see that the growth is accelerating.
More Decent Value stocks can be found in our Decent Value screener.
Check the latest full fundamental report of BIDU for a complete fundamental analysis.
Disclaimer
This article should in no way be interpreted as advice. The article is based on the observed metrics at the time of writing, but you should always make your own analysis and trade or invest at your own responsibility.
