Why the dividend investor may take a look at BEST BUY CO INC (NYSE:BBY).
By Mill Chart
Last update: Apr 28, 2025
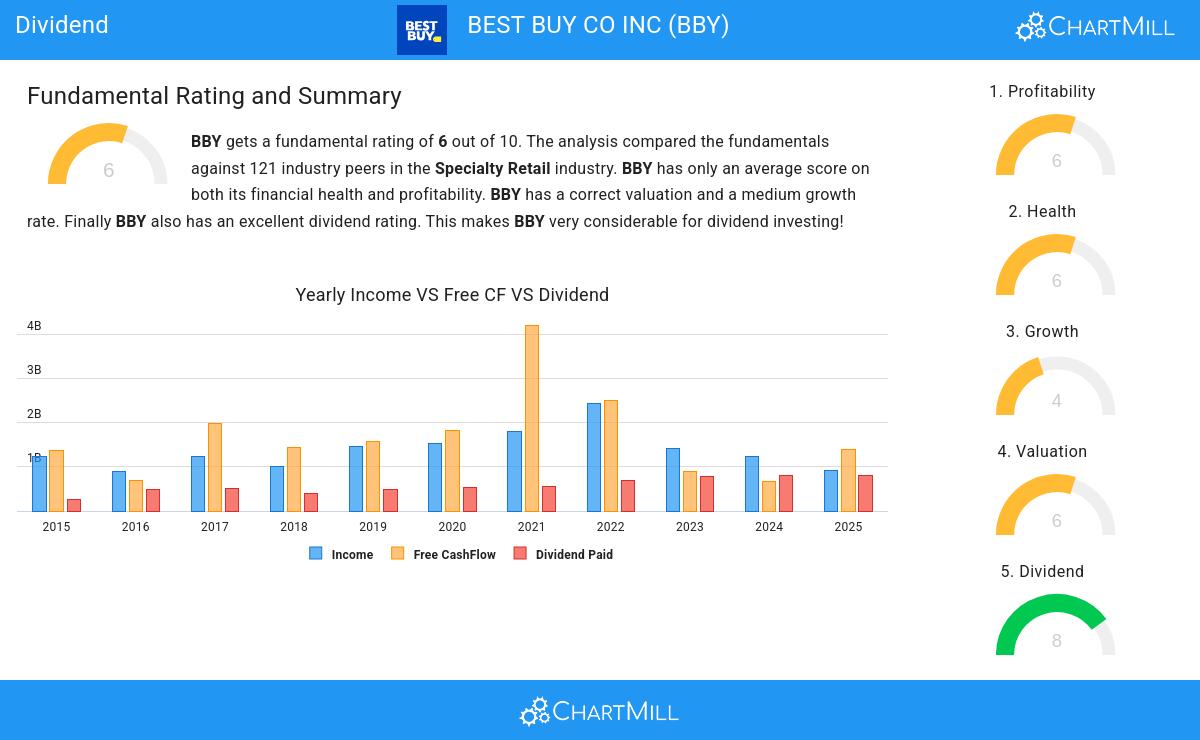
Our stock screener has singled out BEST BUY CO INC (NYSE:BBY) as a promising choice for dividend investors. BBY not only scores well in profitability, solvency, and liquidity but also offers a decent dividend. We'll explore this further.
Understanding BBY's Dividend Score
ChartMill employs its own Dividend Rating system for all stocks. This score, on a scale of 0 to 10, is determined by evaluating different dividend factors, such as yield, historical performance, dividend growth, and sustainability. BBY has been assigned a 8 for dividend:
- With a Yearly Dividend Yield of 5.76%, BBY is a good candidate for dividend investing.
- Compared to an average industry Dividend Yield of 5.39, BBY pays a better dividend. On top of this BBY pays more dividend than 91.74% of the companies listed in the same industry.
- Compared to an average S&P500 Dividend Yield of 2.46, BBY pays a better dividend.
- The dividend of BBY is nicely growing with an annual growth rate of 13.37%!
- BBY has been paying a dividend for at least 10 years, so it has a reliable track record.
- BBY has not decreased their dividend for at least 10 years, which is a reliable track record.
Evaluating Health: BBY
ChartMill utilizes a Health Rating to assess stocks, scoring them on a scale of 0 to 10. This rating takes into account a variety of liquidity and solvency ratios, both in absolute terms and in comparison to industry peers. BBY has earned a 6 out of 10:
- An Altman-Z score of 4.17 indicates that BBY is not in any danger for bankruptcy at the moment.
- The Altman-Z score of BBY (4.17) is better than 86.78% of its industry peers.
- The Debt to FCF ratio of BBY is 0.83, which is an excellent value as it means it would take BBY, only 0.83 years of fcf income to pay off all of its debts.
- BBY has a Debt to FCF ratio of 0.83. This is in the better half of the industry: BBY outperforms 78.51% of its industry peers.
- BBY has a Debt/Equity ratio of 0.41. This is a healthy value indicating a solid balance between debt and equity.
Exploring BBY's Profitability
ChartMill assigns a proprietary Profitability Rating to each stock. The score is computed by evaluating various profitability ratios and margins and ranges from 0 to 10. BBY was assigned a score of 6 for profitability:
- The Return On Assets of BBY (6.27%) is better than 73.55% of its industry peers.
- With an excellent Return On Equity value of 33.01%, BBY belongs to the best of the industry, outperforming 86.78% of the companies in the same industry.
- With an excellent Return On Invested Capital value of 18.94%, BBY belongs to the best of the industry, outperforming 86.78% of the companies in the same industry.
- The Average Return On Invested Capital over the past 3 years for BBY is significantly above the industry average of 13.10%.
- BBY has a better Profit Margin (2.23%) than 60.33% of its industry peers.
Every day, new Best Dividend stocks can be found on ChartMill in our Best Dividend screener.
Check the latest full fundamental report of BBY for a complete fundamental analysis.
Disclaimer
This is not investing advice! The article highlights some of the observations at the time of writing, but you should always make your own analysis and invest based on your own insights.
67.71
+1.71 (+2.59%)
Find more stocks in the Stock Screener
BBY Latest News and Analysis
 2 minutes ago - ChartmillWhy the dividend investor may take a look at BEST BUY CO INC (NYSE:BBY).
Exploring BEST BUY CO INC (NYSE:BBY)'s dividend characteristics.
 14 days ago - ChartmillGapping S&P500 stocks in Monday's session
Looking for opportunities in today's market? Check out the S&P500 gap up and gap down stocks on Monday and stay ahead of the market trends.
 14 days ago - ChartmillGet insights into the top movers in the S&P500 index of Monday's pre-market session.
Let's have a look at what is happening on the US markets before the opening bell on Monday. Below you can find the top S&P500 gainers and losers in today's pre-market session.
 20 days ago - ChartmillTuesday's session: top gainers and losers in the S&P500 index
Curious about the top performers within the S&P500 index one hour before the close of the markets on Tuesday? Dive into the list of today's session's top gainers and losers for a comprehensive overview.
