
Based on good technical signals, BANK OF AMERICA CORP is potentially setting up for a breakout.
By Mill Chart
Last update: Feb 10, 2025
We've identified BANK OF AMERICA CORP (NYSE:BAC) as a potential breakout candidate based on our stock screener's analysis. This breakout setup pattern suggests that after a strong uptrend, the stock is currently consolidating, potentially signaling a continuation of the trend. Keep an eye on NYSE:BAC for further developments.
What is the technical picture of NYSE:BAC telling us.
ChartMill assigns a proprietary Technical Rating to each stock. The score is computed daily by evaluating various technical indicators and properties. The score ranges from 0 to 10.
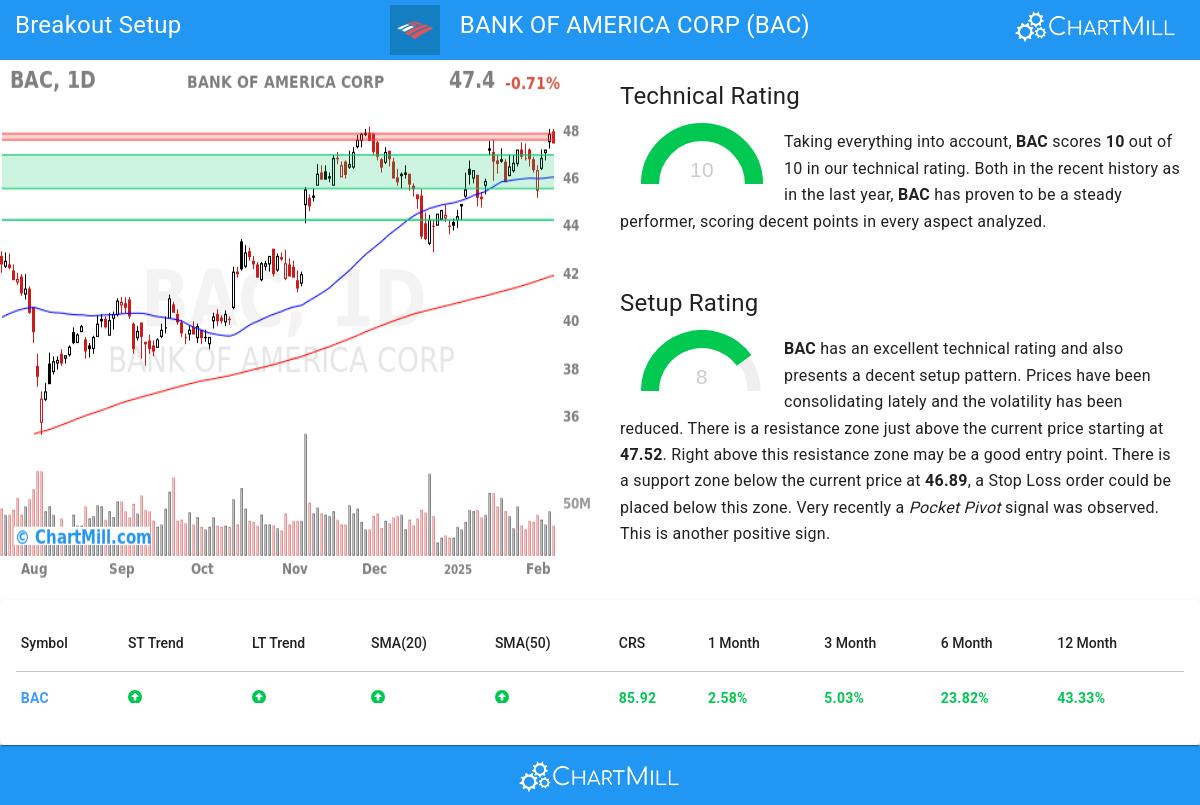
Overall BAC gets a technical rating of 10 out of 10. Both in the recent history as in the last year, BAC has proven to be a steady performer, scoring decent points in every aspect analyzed.
- Both the short term and long term trends are positive. This is a very positive sign.
- When comparing the yearly performance of all stocks, we notice that BAC is one of the better performing stocks in the market, outperforming 85% of all stocks. On top of that, BAC also shows a nice and consistent pattern of rising prices.
- BAC is one of the better performing stocks in the Banks industry, it outperforms 82% of 404 stocks in the same industry.
- BAC is currently trading near its 52 week high, which is a good sign. The S&P500 Index however is also trading near new highs, which makes the performance in line with the market.
- In the last month BAC has a been trading in the 44.69 - 47.98 range, which is quite wide. It is currently trading near the high of this range.
- Prices have been consolidating recently, this may present a good entry opportunity.
For an up to date full technical analysis you can check the technical report of BAC
Looking at the Setup
Alongside the Technical Rating, ChartMill assigns a Setup Rating to evaluate the consolidation level of a stock. This rating, ranging from 0 to 10, is updated daily and considers various short-term technical indicators. The current setup rating for NYSE:BAC is 8:
Besides having an excellent technical rating, BAC also presents a decent setup pattern. Prices have been consolidating lately and the volatility has been reduced. There is a resistance zone just above the current price starting at 47.52. Right above this resistance zone may be a good entry point. There is a support zone below the current price at 46.89, a Stop Loss order could be placed below this zone. Very recently a Pocket Pivot signal was observed. This is another positive sign.
Trading breakout setups.
A breakout opportunity may arise when the stock surpasses the current consolidation zone and reaches new highs. Traders often wait for this breakout before considering buying the stock. To manage risk, a stop loss order could be placed below the consolidation zone to limit potential losses.
Disclaimer: This article is not intended to provide trading advice. It is crucial to conduct your own analysis and consider your own observations and trading style when making investment decisions. The article solely presents technical observations and should not be relied upon as a sole basis for trading.
Every day, new breakout setups can be found on ChartMill in our Breakout screener.
Disclaimer
This article should in no way be interpreted as advice. The article is based on the observed metrics at the time of writing, but you should always make your own analysis and trade or invest at your own responsibility.
39.58
+0.83 (+2.14%)
Find more stocks in the Stock Screener
BAC Latest News and Analysis
 10 hours ago - ChartmillMost active S&P500 stocks in Thursday's session
Looking for the most active S&P500 stocks in today's session? Join us as we dive into the US markets on Thursday and discover the stocks that are dominating the trading activity and setting the pace for the market.
a day ago - ChartmillLooking for the most active stocks in the S&P500 index on Wednesday?Explore the S&P500 index on Wednesday and find out which stocks are the most active in today's session. Stay updated with the stocks that are capturing market interest.
7 days ago - ChartmillThursday's session: most active stock in the S&P500 indexLooking for the most active S&P500 stocks in today's session? Join us as we dive into the US markets on Thursday and discover the stocks that are dominating the trading activity and setting the pace for the market.
8 days ago - ChartmillMost active S&P500 stocks in Wednesday's sessionStay informed about the most active S&P500 stocks in today's session as we take a closer look at what's happening on the US markets on Wednesday. Discover the stocks that are generating the highest trading volume and driving market activity.
 9 days ago - ChartmillMarket Monitor April 16 ( Netflix, Palantir UP, Nvidia, Applied Digital DOWN)
Calm Trading on Wall Street as Netflix Shines, Nvidia Stumbles after-hours
 9 days ago - ChartmillUncover the latest developments among S&P500 stocks in today's session.
Stay informed about the performance of the S&P500 index one hour before the close of the markets on Tuesday. Uncover the top gainers and losers in today's session for valuable insights.
9 days ago - ChartmillMost active S&P500 stocks in Tuesday's sessionStay informed about the most active S&P500 stocks in today's session as we take a closer look at what's happening on the US markets on Tuesday. Discover the stocks that are generating the highest trading volume and driving market activity.
9 days ago - ChartmillWhich S&P500 stocks are moving on Tuesday?Stay informed about the performance of the S&P500 index in the middle of the day on Tuesday. Uncover the top gainers and losers in today's session for valuable insights.
10 days ago - ChartmillWhat's going on in today's session: S&P500 most active stocksExplore the S&P500 index on Monday and find out which stocks are the most active in today's session. Stay updated with the stocks that are capturing market interest.
13 days ago - ChartmillWhich S&P500 stocks are the most active on Friday?Looking for the most active stocks in the S&P500 index on Friday? Dive into today's session and discover the stocks that are dominating the trading activity and setting the pace for the market.
14 days ago - ChartmillWhat's going on in today's session: S&P500 most active stocksLet's have a look at what is happening on the US markets on Thursday. Below you can find the most active S&P500 stocks in today's session.
 15 days ago - ChartmillThese S&P500 stocks have an unusual volume in today's session
In today's session, there are S&P500 stocks with remarkable trading volume. Explore the stocks exhibiting unusual volume in Wednesday's session.
