Is AXON ENTERPRISE INC (NASDAQ:AXON) suited for high growth investing?
By Mill Chart
Last update: Apr 25, 2025
We've identified AXON ENTERPRISE INC (NASDAQ:AXON) as a potential breakout candidate based on our stock screener's analysis. This breakout setup pattern suggests that after a strong uptrend, the stock is currently consolidating, potentially signaling a continuation of the trend. Keep an eye on NASDAQ:AXON for further developments.
Insights from Technical Analysis
ChartMill assigns a Technical Rating to every stock. This score ranges from 0 to 10 and is updated daily. The score is determined by evaluating multiple technical indicators and properties.
We assign a technical rating of 7 out of 10 to AXON. Although AXON has been one of the better performers in the overall market, we have a mixed picture in the medium term time frame. But recently some decent action can be observed again.
- The short term trend is positive, while the long term trend is neutral. So this is evolving in the right direction.
- When comparing the yearly performance of all stocks, we notice that AXON is one of the better performing stocks in the market, outperforming 96% of all stocks. On top of that, AXON also shows a nice and consistent pattern of rising prices.
- AXON is one of the better performing stocks in the Aerospace & Defense industry, it outperforms 84% of 65 stocks in the same industry.
- In the last month AXON has a been trading in the 469.24 - 594.46 range, which is quite wide. It is currently trading near the high of this range.
- AXON is currently trading in the middle of its 52 week range. This is in line with the S&P500 Index, which is also trading in the middle of its range.
Check the latest full technical report of AXON for a complete technical analysis.
Why is AXON a setup?
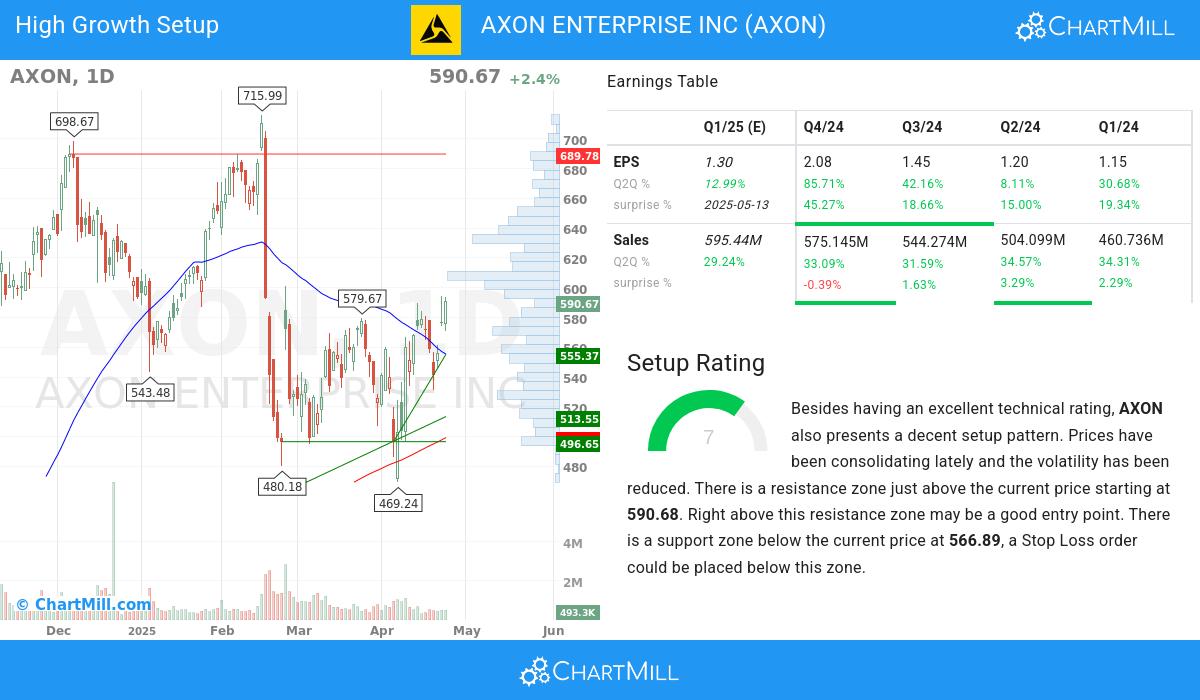
In addition to the Technical Rating, ChartMill provides a Setup Rating for each stock. This rating, ranging from 0 to 10, assesses the level of consolidation in the stock based on multiple short-term technical indicators. Currently, AXON has a 7 as its setup rating, indicating its current consolidation status.
AXON has an excellent technical rating and also presents a decent setup pattern. Prices have been consolidating lately and the volatility has been reduced. There is a resistance zone just above the current price starting at 590.68. Right above this resistance zone may be a good entry point. There is a support zone below the current price at 566.89, a Stop Loss order could be placed below this zone.
Understanding AXON's High Growth Momentum Score
Every stock receives a High Growth Momentum Rating (HGM) from ChartMill, ranging from 0 to 10. This rating assesses various growth and profitability aspects, including historical and projected EPS and revenue growth. AXON boasts a 6 out of 10:
Explosive Earnings Growth
- The quarterly earnings of AXON have shown a 85.71% increase compared to the previous quarter, as revealed in the recent financial report. This growth signifies positive momentum in the company's financials, pointing towards a promising upward trend
- The earnings per share (EPS) growth of AXON is accelerating: the current Q2Q growth of 85.71% is above the previous quarter Q2Q growth of 42.16%. Earnings momentum and acceleration are key for high growth systems.
- EPS growth accelerated for 2 quarters in a row.
- AXON has achieved 42.37% growth in EPS over the past 12 months, reflecting a sustained improvement in earnings performance.
- AXON has achieved 36.34% growth in EPS over the past 3 years, reflecting a sustained improvement in earnings performance.
- The recent q2q revenue growth of 33.09% of AXON showcases the company's ability to generate increasing revenue in a short period, reflecting its positive growth trajectory.
- Accelerating Sales growth for AXON: the current Q2Q growth of 33.09% exceeds the previous quarter Q2Q growth of 31.59%.
- With impressive 1-year revenue growth of 62.68%, AXON showcases its ability to generate increased sales and revenue. This growth highlights the company's strong customer demand and its effective business strategies.
- AXON has a strong history of beating EPS estimates in the last 4 quarters, signaling its ability to consistently exceed market expectations. This indicates the company's strong financial performance and its potential for creating shareholder value.
Financial Strength & Profitability
- The profit margin of AXON has seen steady growth over the past year, signaling improved profitability.
- With a favorable trend in its free cash flow (FCF) over the past year, AXON demonstrates its ability to generate robust cash flows and maintain financial stability. This growth reflects the company's focus on efficient capital allocation and cash management.
- AXON exhibits a strong Return on Equity (ROE) of 21.92%, indicating the company's ability to generate solid returns on shareholder investments. This metric reflects the company's efficient utilization of equity capital and its profitability.
- With a current Debt-to-Equity ratio at 0.29, AXON showcases its disciplined capital structure. The company's prudent management of debt obligations contributes to its financial stability and long-term sustainability.
Market Strength & Institutional Confidence
- AXON exhibits a favorable ownership structure, with an institutional shareholder ownership of 82.93%. This signifies a diverse investor base, which can contribute to a more stable and efficient market for the stock.
- AXON has maintained a healthy Relative Strength (RS) over the analyzed period, with a current 96.02 rating. This demonstrates the stock's ability to outperform its peers and indicates its competitive positioning.
More high growth momentum breakout stocks can be found in our High Growth Momentum Breakout screen.
Keep in mind
This article should in no way be interpreted as advice. The article is based on the observed metrics at the time of writing, but you should always make your own analysis and trade or invest at your own responsibility.
590.67
+13.77 (+2.39%)
Find more stocks in the Stock Screener
AXON Latest News and Analysis
 3 minutes ago - ChartmillIs AXON ENTERPRISE INC (NASDAQ:AXON) suited for high growth investing?
A fundamental and technical analysis of (NASDAQ:AXON): Why the high growth investor may take a look at AXON ENTERPRISE INC (NASDAQ:AXON).
 4 days ago - ChartmillGet insights into the top movers in the S&P500 index of Monday's pre-market session.
Discover the top S&P500 movers in Monday's pre-market session and stay informed about market dynamics.
 15 days ago - ChartmillWhy the growth investor may take a look at AXON ENTERPRISE INC (NASDAQ:AXON).
A fundamental analysis of (NASDAQ:AXON): Is AXON ENTERPRISE INC (NASDAQ:AXON) suited for growth investing?
