Uncovering Dividend Opportunities with AMPHENOL CORP-CL A (NYSE:APH).
By Mill Chart
Last update: Apr 16, 2025
AMPHENOL CORP-CL A (NYSE:APH) was identified as a stock worth exploring by dividend investors by our stock screener. APH scores well on profitability, solvency and liquidity. At the same time it seems to pay a decent dividend. We'll explore this a bit deeper below.
Assessing Dividend for APH
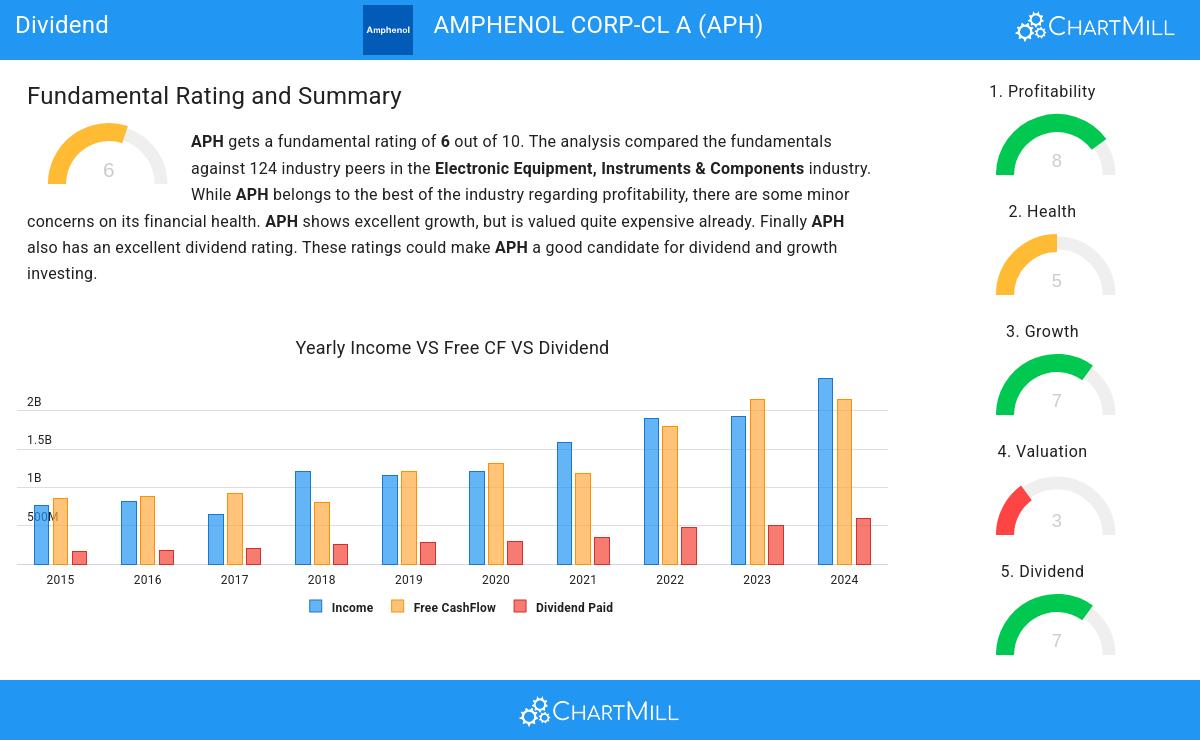
ChartMill assigns a proprietary Dividend Rating to each stock. The score is computed by evaluating various valuation aspects, like the yield, the history, the dividend growth and sustainability. APH was assigned a score of 7 for dividend:
- APH's Dividend Yield is rather good when compared to the industry average which is at 2.45. APH pays more dividend than 86.29% of the companies in the same industry.
- APH has been paying a dividend for at least 10 years, so it has a reliable track record.
- APH has not decreased its dividend for at least 10 years, so it has a reliable track record of non decreasing dividend.
- APH pays out 24.55% of its income as dividend. This is a sustainable payout ratio.
- APH's earnings are growing more than its dividend. This makes the dividend growth sustainable.
What does the Health looks like for APH
ChartMill assigns a proprietary Health Rating to each stock. The score is computed by evaluating various liquidity and solvency ratios and ranges from 0 to 10. APH was assigned a score of 5 for health:
- An Altman-Z score of 6.10 indicates that APH is not in any danger for bankruptcy at the moment.
- APH's Altman-Z score of 6.10 is amongst the best of the industry. APH outperforms 82.26% of its industry peers.
- The Debt to FCF ratio of APH is 3.20, which is a good value as it means it would take APH, 3.20 years of fcf income to pay off all of its debts.
- Looking at the Debt to FCF ratio, with a value of 3.20, APH is in the better half of the industry, outperforming 65.32% of the companies in the same industry.
- A Current Ratio of 2.37 indicates that APH has no problem at all paying its short term obligations.
A Closer Look at Profitability for APH
ChartMill assigns a Profitability Rating to every stock. This score ranges from 0 to 10 and evaluates the different profitability ratios and margins, both absolutely, but also relative to the industry peers. APH scores a 8 out of 10:
- APH's Return On Assets of 11.31% is amongst the best of the industry. APH outperforms 91.94% of its industry peers.
- With an excellent Return On Equity value of 24.76%, APH belongs to the best of the industry, outperforming 91.94% of the companies in the same industry.
- APH has a Return On Invested Capital of 15.17%. This is amongst the best in the industry. APH outperforms 92.74% of its industry peers.
- The Average Return On Invested Capital over the past 3 years for APH is significantly above the industry average of 9.26%.
- Looking at the Profit Margin, with a value of 15.92%, APH belongs to the top of the industry, outperforming 93.55% of the companies in the same industry.
- In the last couple of years the Profit Margin of APH has grown nicely.
- Looking at the Operating Margin, with a value of 21.57%, APH belongs to the top of the industry, outperforming 99.19% of the companies in the same industry.
- APH's Operating Margin has improved in the last couple of years.
Every day, new Best Dividend stocks can be found on ChartMill in our Best Dividend screener.
Our latest full fundamental report of APH contains the most current fundamental analsysis.
Disclaimer
This is not investing advice! The article highlights some of the observations at the time of writing, but you should always make your own analysis and invest based on your own insights.
65.06
+0.29 (+0.45%)
Find more stocks in the Stock Screener
APH Latest News and Analysis
 2 days ago - ChartmillUncovering Dividend Opportunities with AMPHENOL CORP-CL A (NYSE:APH).
Why AMPHENOL CORP-CL A (NYSE:APH) provides a good dividend, while having solid fundamentals.
